VannoPortal Usage Documentation Introduction Terminology in VannoPortal VannoPortal Usage Data used in VannoPortal Contact
VannoPortal Usage Documentation
Introduction
Interpreting molecular mechanism of genomic variations and their causal relationships with diseases/traits are challenging and important problems in human genetics study. VannoPortal is a variant annotation database that comprehensively collects and integrates genome-wide variant annotations and prediction scores to benefit systematical and context-specific variant annotations for biologists and clinicians. The following introductions and tutorials will help user understand the data content and usage of VannoPortal.
Terminology in VannoPortal
- Variant: an alteration in the most common DNA nucleotide sequence; or refers to genetic variant. In VannoPortal, both germline variant and somatic mutation are referred to variant.
- Linkage Disequilibrium (LD): the non-random association of alleles at different loci in a given population.
- Trait: usually refers to phenotype of a population of organism. A tissue/cell type-specific cellular function that can also be quantified by a particular assay, called molecular trait, such as methylation level, gene expression and protein expression.
- Quantitative trait locus (QTL): genomic locus (e.g., a genetic variant) which correlates with variation of a quantitative phenotype of a population of organism.
- xQTL: genomic locus (e.g., a genetic variant) that explains all or a fraction of variation in certain molecular trait (no matter which trait) is referred to as xQTL.
- Regulatory potential: here refers to the ability or potential of given variant to regulate gene expression via different mechanisms.
- Pathogenicity: here refers to a given variant that increases an individual’s susceptibility or predisposition to a certain disease or disorder.
- Oncogenicity: here refers to a given mutation that increases the positive selection advantage in cell growth and fitness, and usually have ability of tumor formation.
- Allelic imbalance: is a phenomenon where the two alleles of a given gene are expressed or regulated at different levels in a given cell.
- Mutation actionability: indicate the availability of drugs that target specific mutations in cancer.
VannoPortal Usage
1. Query Formats
VannoPortal accepts flexible types of genomic variant as query input, including dbSNP ID, VCF-like, HGVS and even only genomic coordinates, for examples:
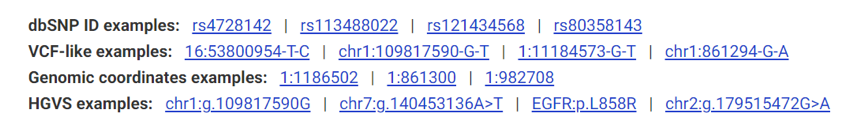
Both GRCh37/hg19 and GRCh38/hg38 of human genome assembly are well supported.
For genomic coordinate query, some users may not know the exact alleles of given variant, VannoPortal will extract reference allele from backend database and treat the query variant as a SNV with three other alternative alleles nominated. Thus, different alternative alleles of this SNV can be selected and switched in the result page.
2. Result page
VannoPortal equips our recent novel index system and parallel random-sweep searching algorithms for efficient management of backend databases and information extraction (Huang et al. Genome Res. 2020;30(12):1789-1801). Therefore, it enables fast retrieve and direct comparison of functional evidence among linked variants using highly interactive web panel in addition to plain table and introduces many visualization functions for more efficient identification and interpretation of functional variants in one rich page.
-
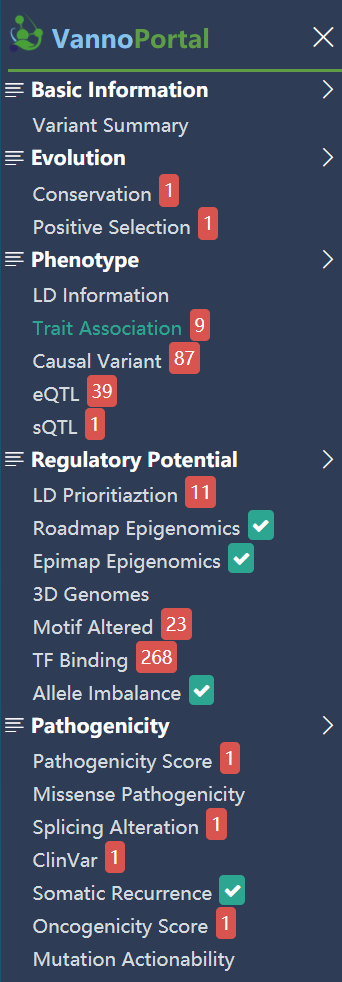
Navigation bar
VannPortal incorporates five major annotation domains (including variant basic information, evolution, phenotype, regulatory potential, pathogenicity) and several important sub-categories in each domain. The navigation bar displays the hit status of query variant on each of sub-categories. By clicking the name of sub-category, the page will scroll to the detailed panel of corresponding item.
-
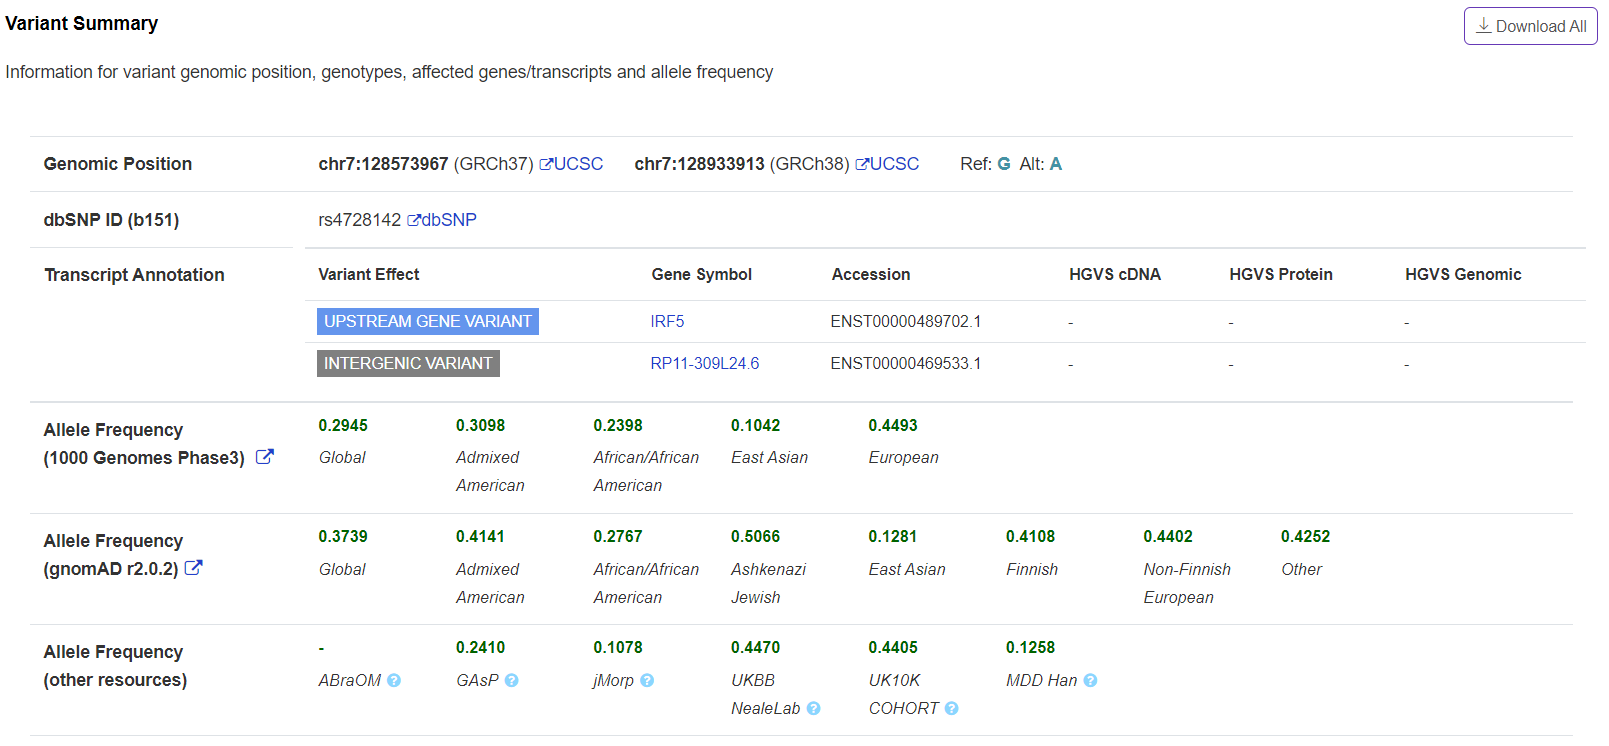
Basic information – Variant Summary
The panel displays variant summary information including variant genomic position, genotypes, affected genes/transcripts and allele frequency. Since most of these information are well maintained in public database, such as UCSC genome browser, Ensembl genome browser, dbSNP, and gnomAD. VannoPortal provides direct link to corresponding browser for full information.
-
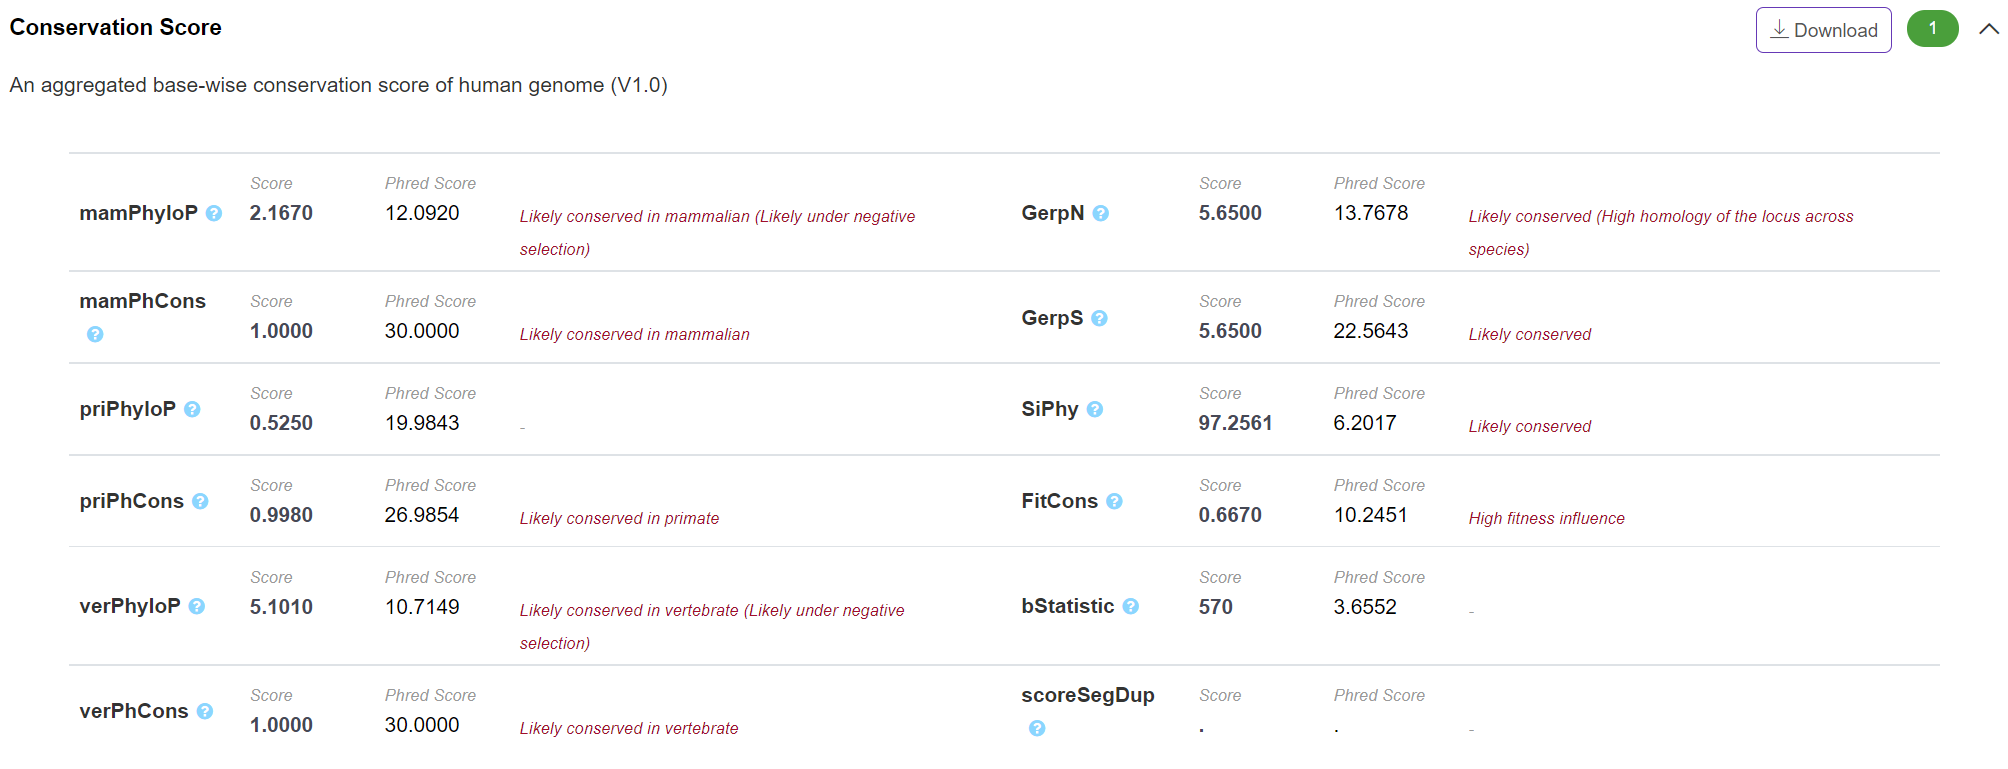
Evolution - Conservation Score
The panel displays genome-scale base-wise conservation scores integrated from different commonly-used conservation scoring algorithms. VannoPortal calculates the "PHRED-scaled" for each of these scores by taking the rank in order of magnitude terms rather than the precise rank itself. For example, reference genome single nucleotide variants at the 10% of PhyloP scores are assigned to PhyloP-10, top 1% to PhyloP-20, top 0.1% to PhyloP-30 based on "PHRED-scaled" score. In addition, VannoPortal reports the conserved/evolutionarily-selected classification of certain score based on its reported cutoff in the literature.
-
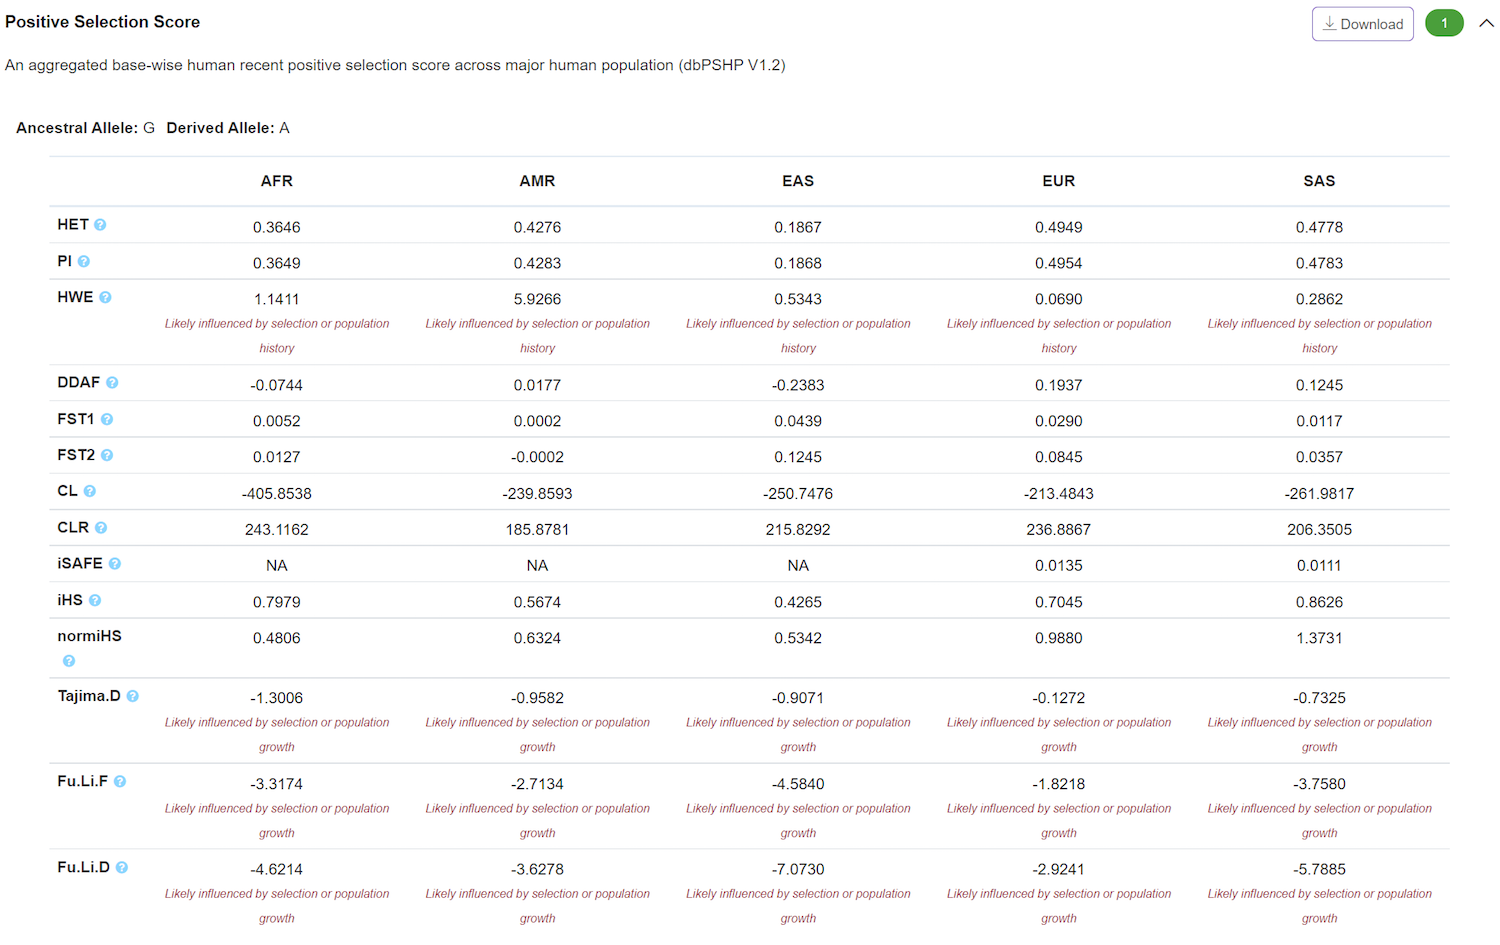
Evolution – Positive Selection Score
The panel displays variant-level positive selection score calculated based on 1000 Genomes project phase3 individual genotypes at different level. This is an updated version of our previous dbPSHP scores which was based on 1000 Genomes project phase1 individual genotypes. The selection score from perspectives of allele frequency or long-range haplotype helps researchers to efficiently identify and validate putative positively selected loci in human evolution and further discover the mechanism governing these natural selections. According to the empirical cutoffs, VannoPortal also reports the classification of selection types.
-
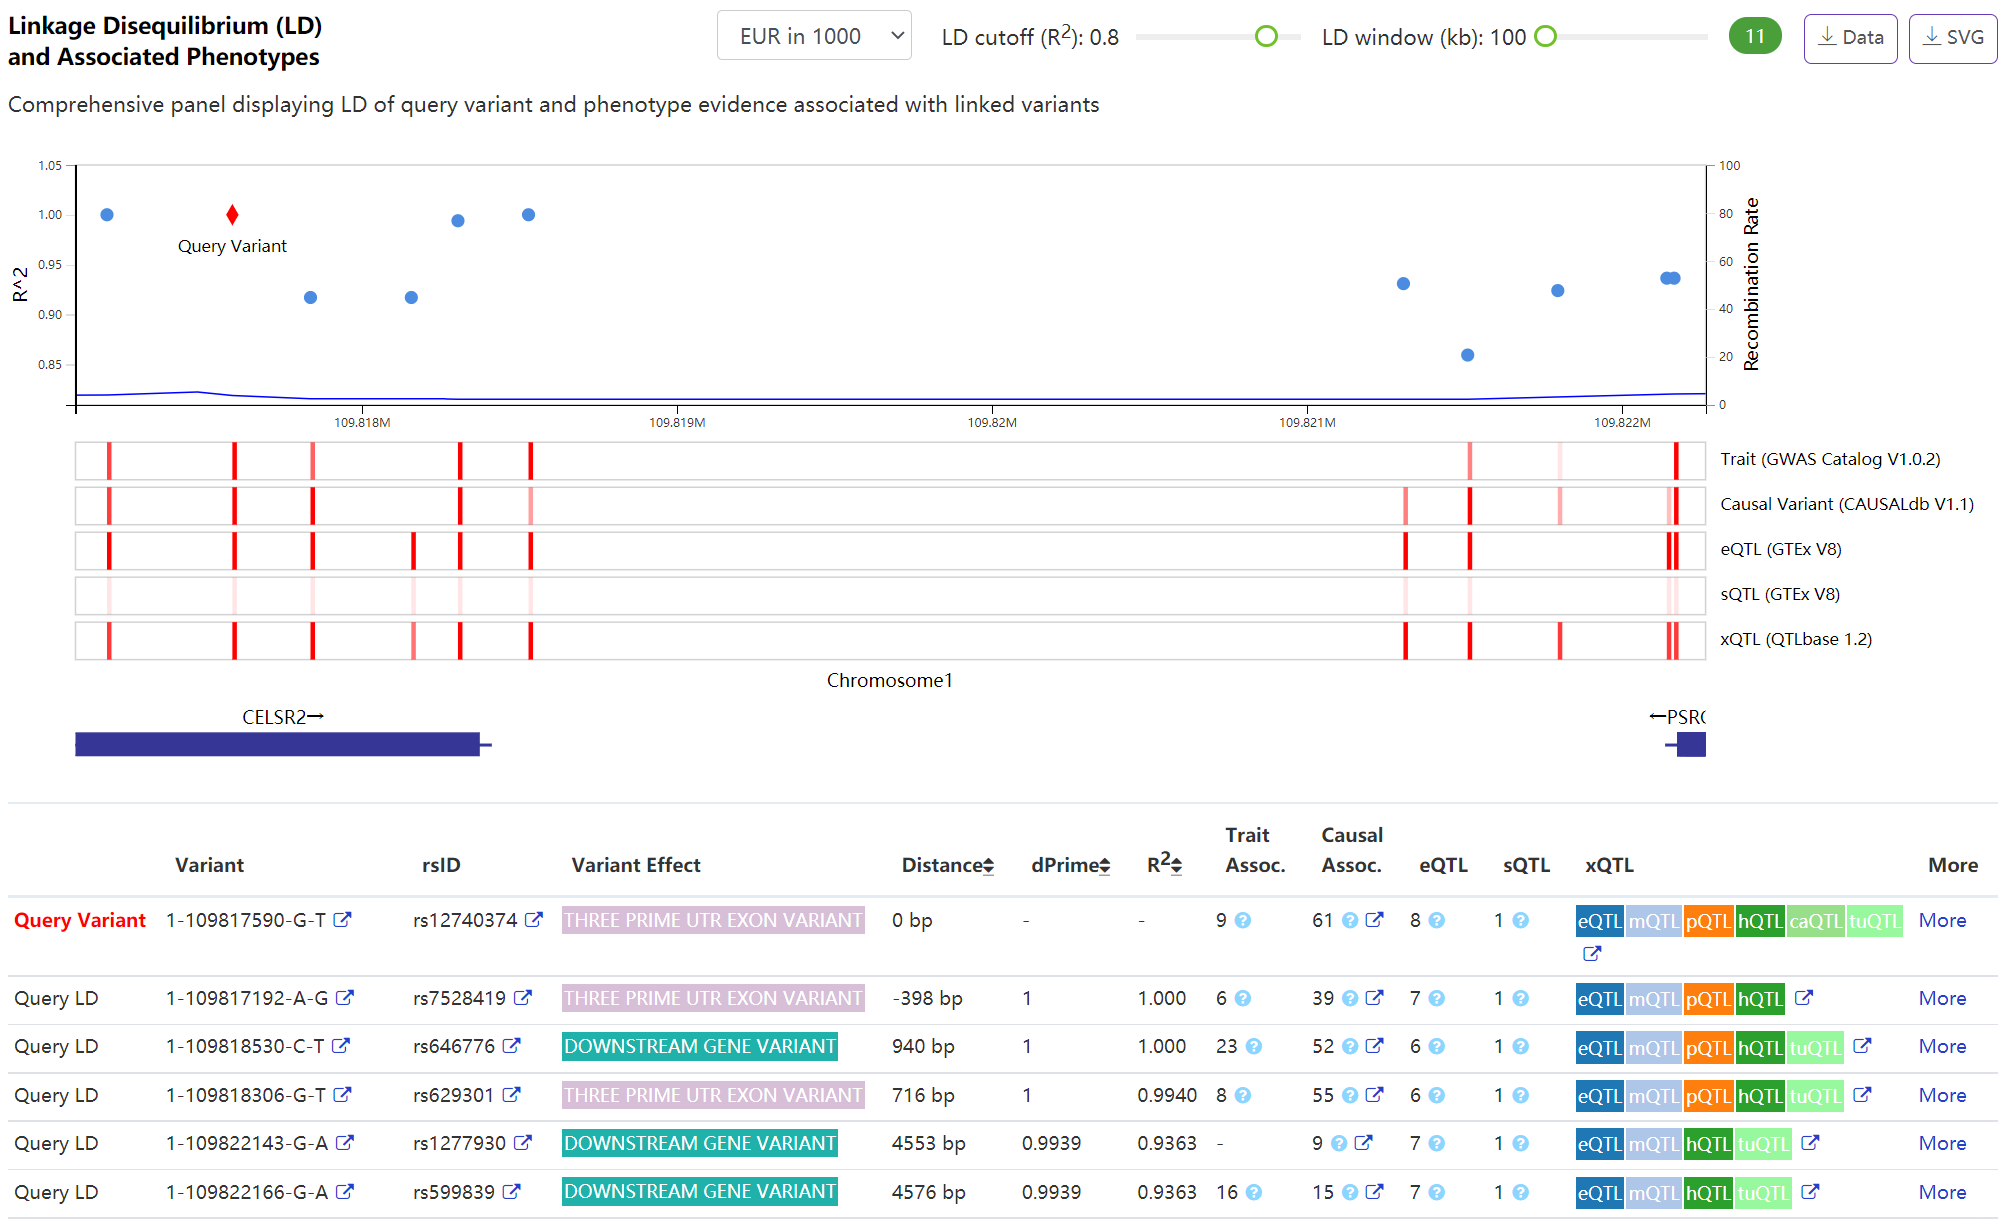
Phenotype - Linkage Disequilibrium (LD) and Associated Phenotypes
The highly interactive panel allows user to browse the LD pattern and associated variants linked to query variant. By leveraging our recent novel index system and random-sweep searching algorithms VarNote, it can efficiently perform variants expansion in LD region when adjusting the interested population, LD cutoff or window size. In addition, VannoPortal incorporates several phenotype evidence (e.g. GWAS and QTL) to annotate variants in the LD region using bottom tracks. By hovering the bar glyph or checking following table, user can inspect detailed information.
-
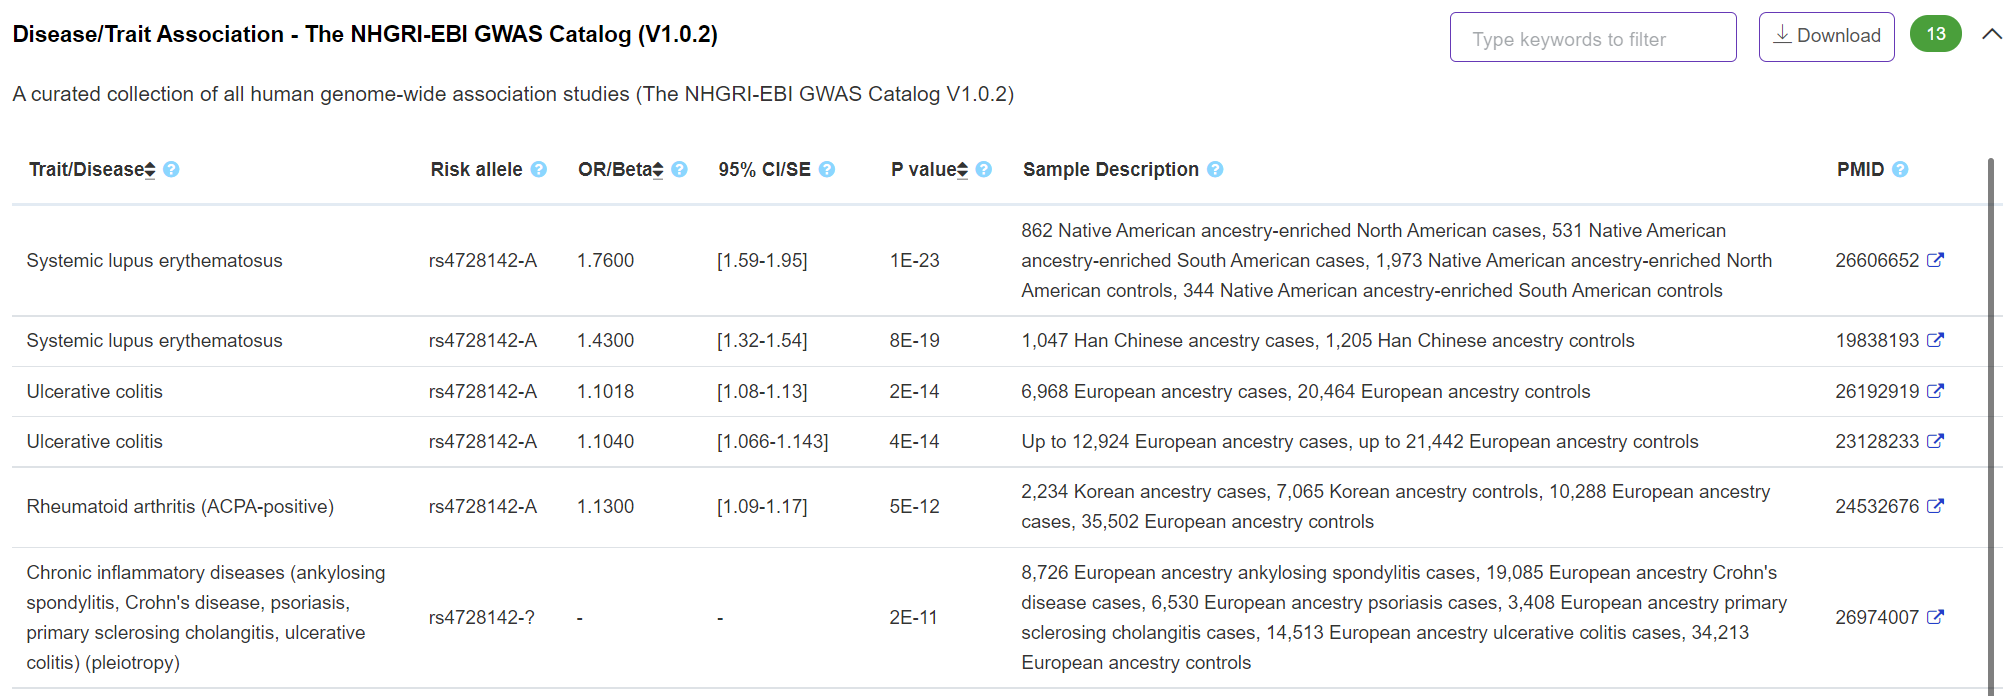
Phenotype - Disease/Trait Association
The panel displays important disease/trait association information derived from The NHGRI-EBI GWAS Catalog (https://www.ebi.ac.uk/gwas/)
-
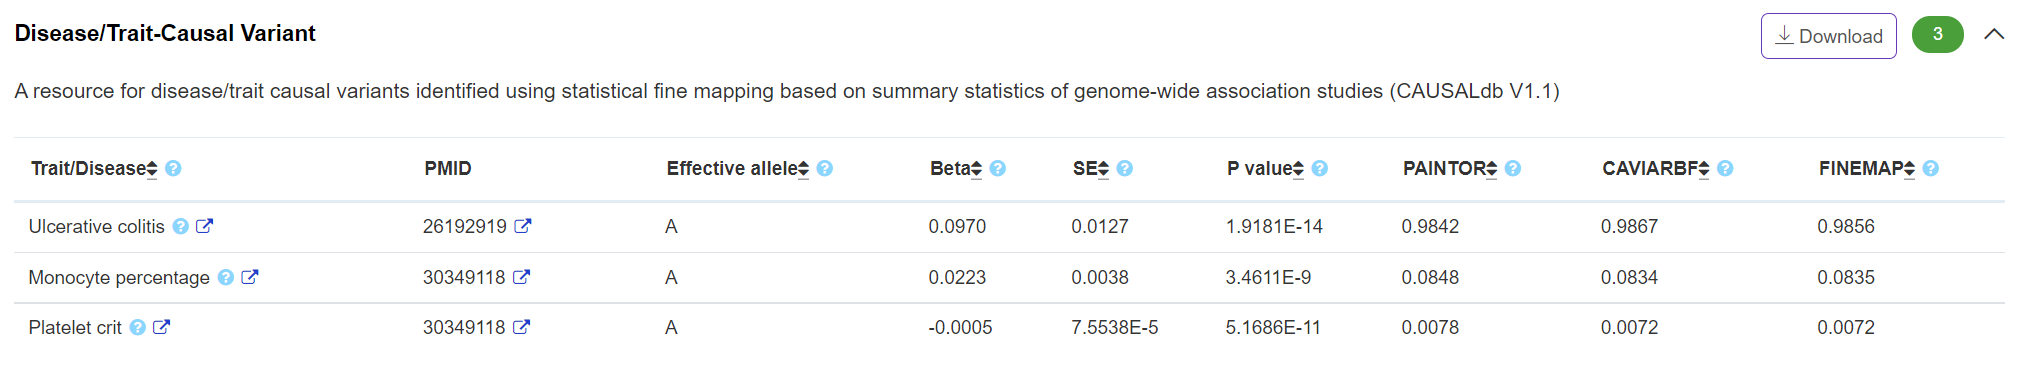
Phenotype - Disease/Trait-Causal Variant
The panel displays disease/trait-causal association derived from CAUSALdb (http://mulinlab.org/causaldb). Three fine-mapping posterior probabilities from three tools are reported.
-
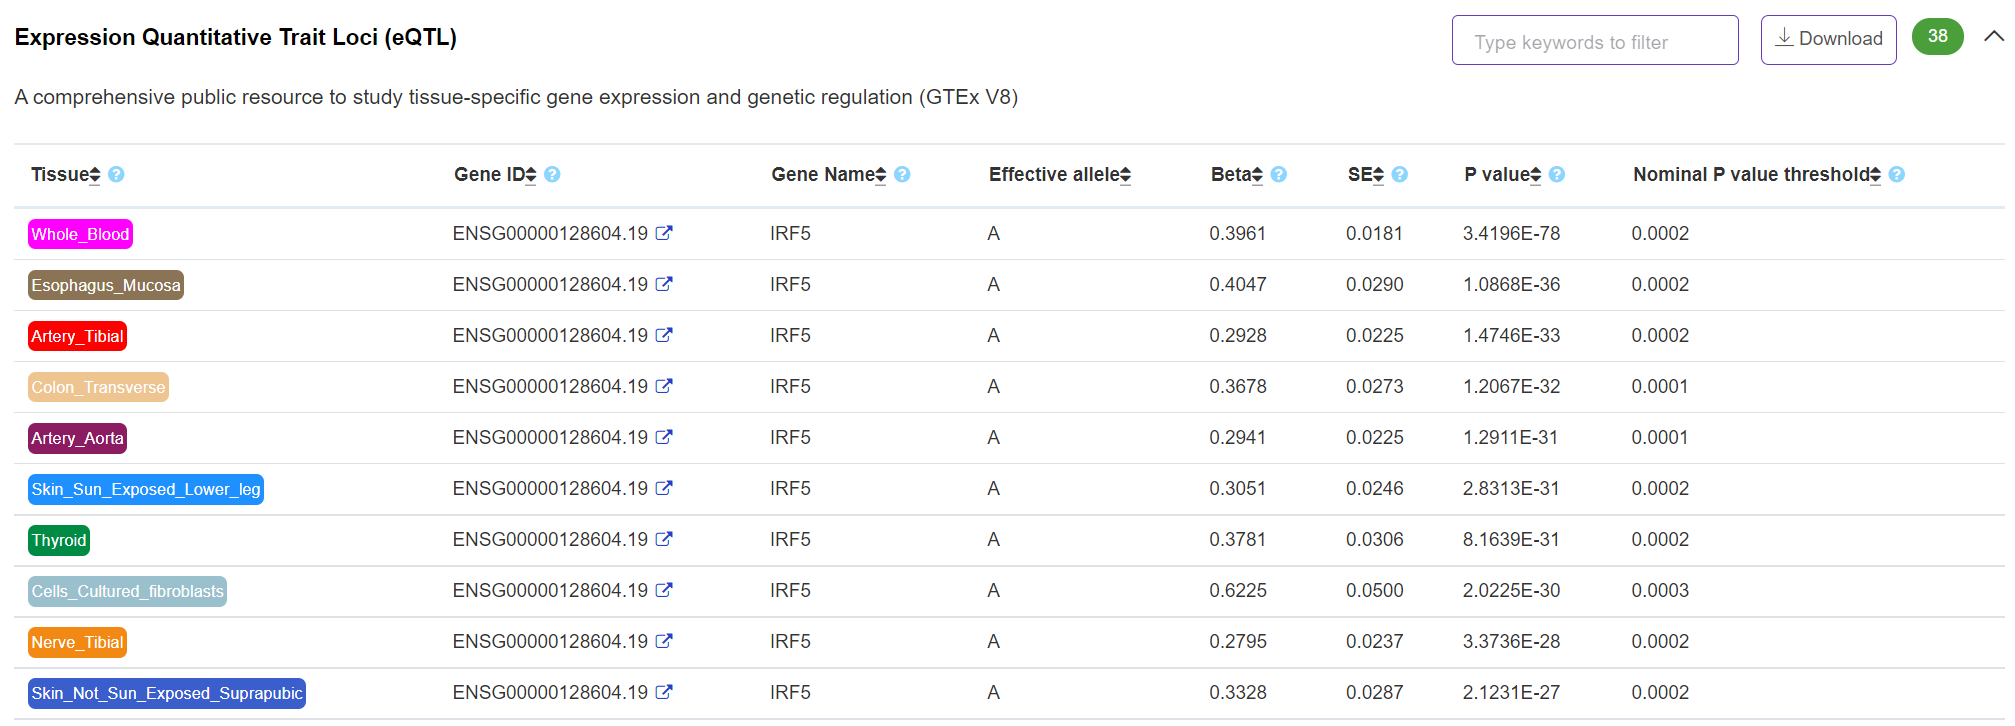
Phenotype - Expression Quantitative Trait Loci (eQTL)
The panel displays tissue/cell type-specific eQTL evidence from GTEx eGene and significant variant-gene associations based on cis-QTL mapping (permutations) (https://www.gtexportal.org/home/).
-
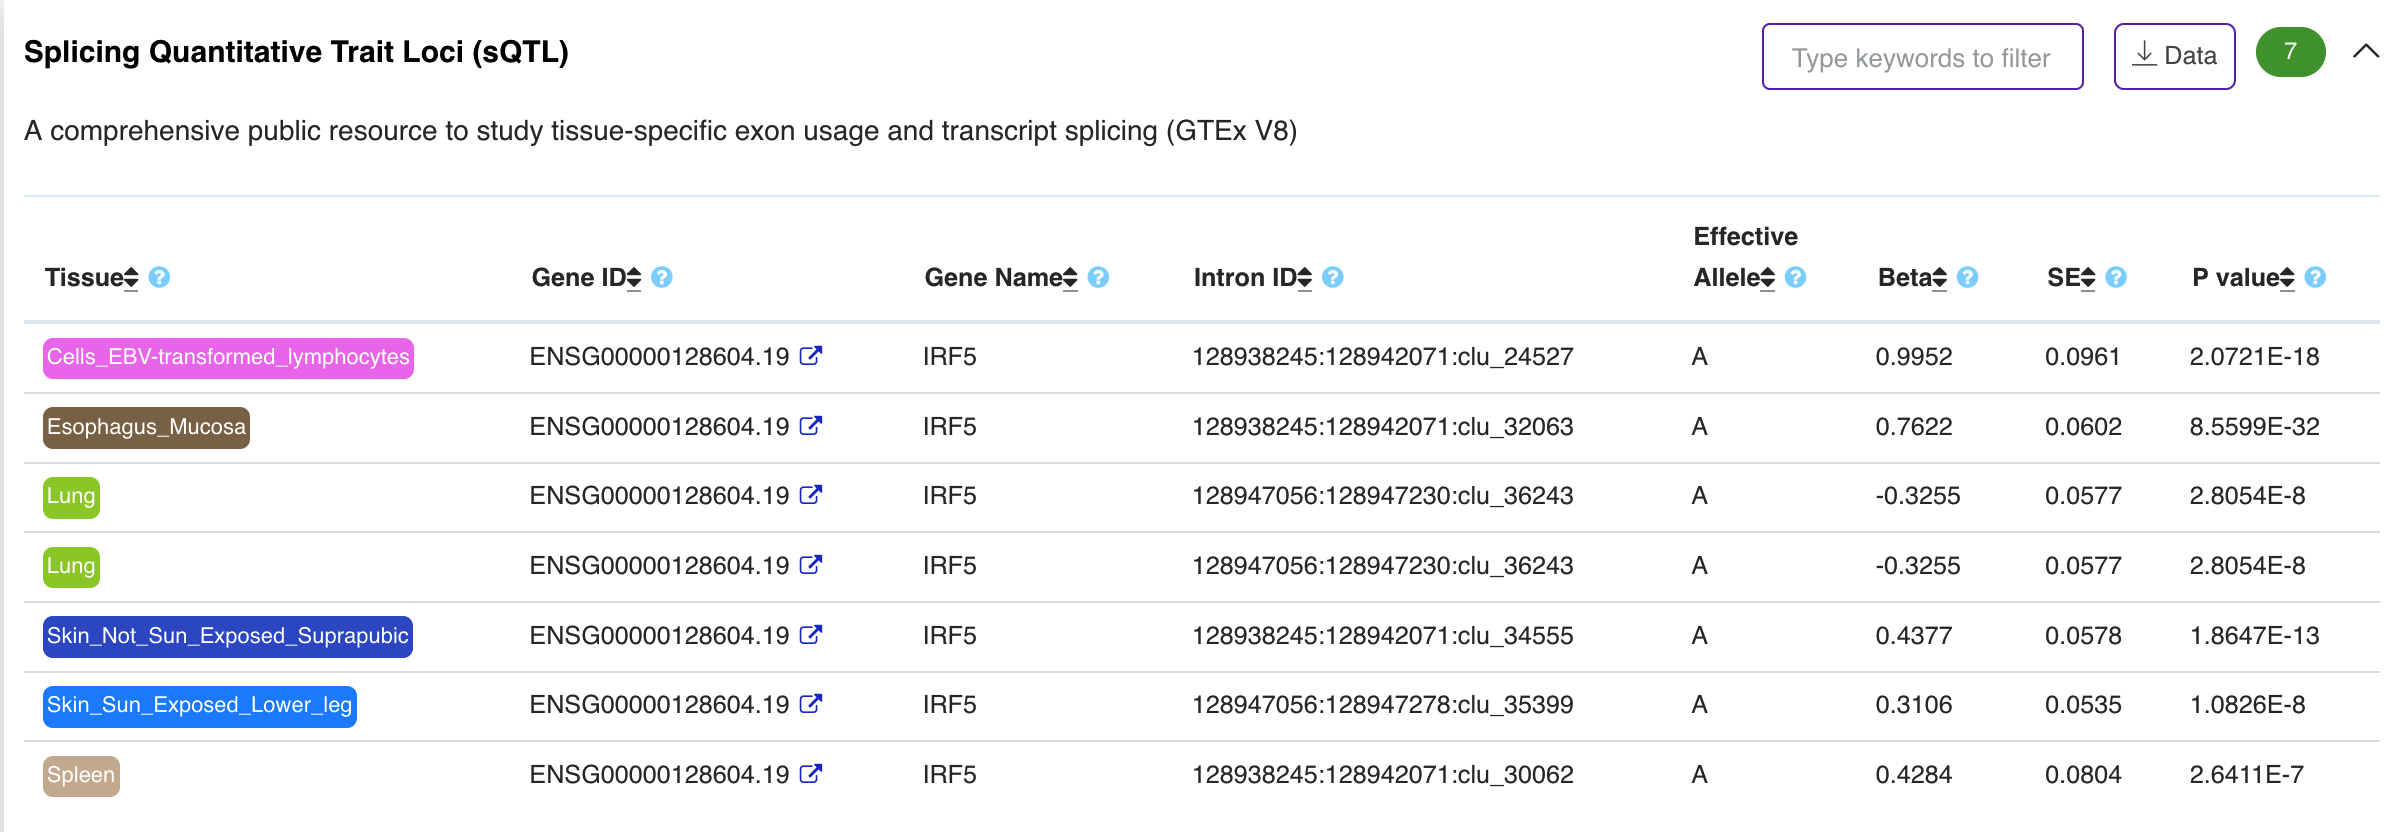
Phenotype – Splicing Quantitative Trait Loci (sQTL)
The panel displays tissue/cell type-specific sQTL evidences from GTEx significant variant-gene associations based on cis-QTL mapping (permutations) (https://www.gtexportal.org/home/).
-
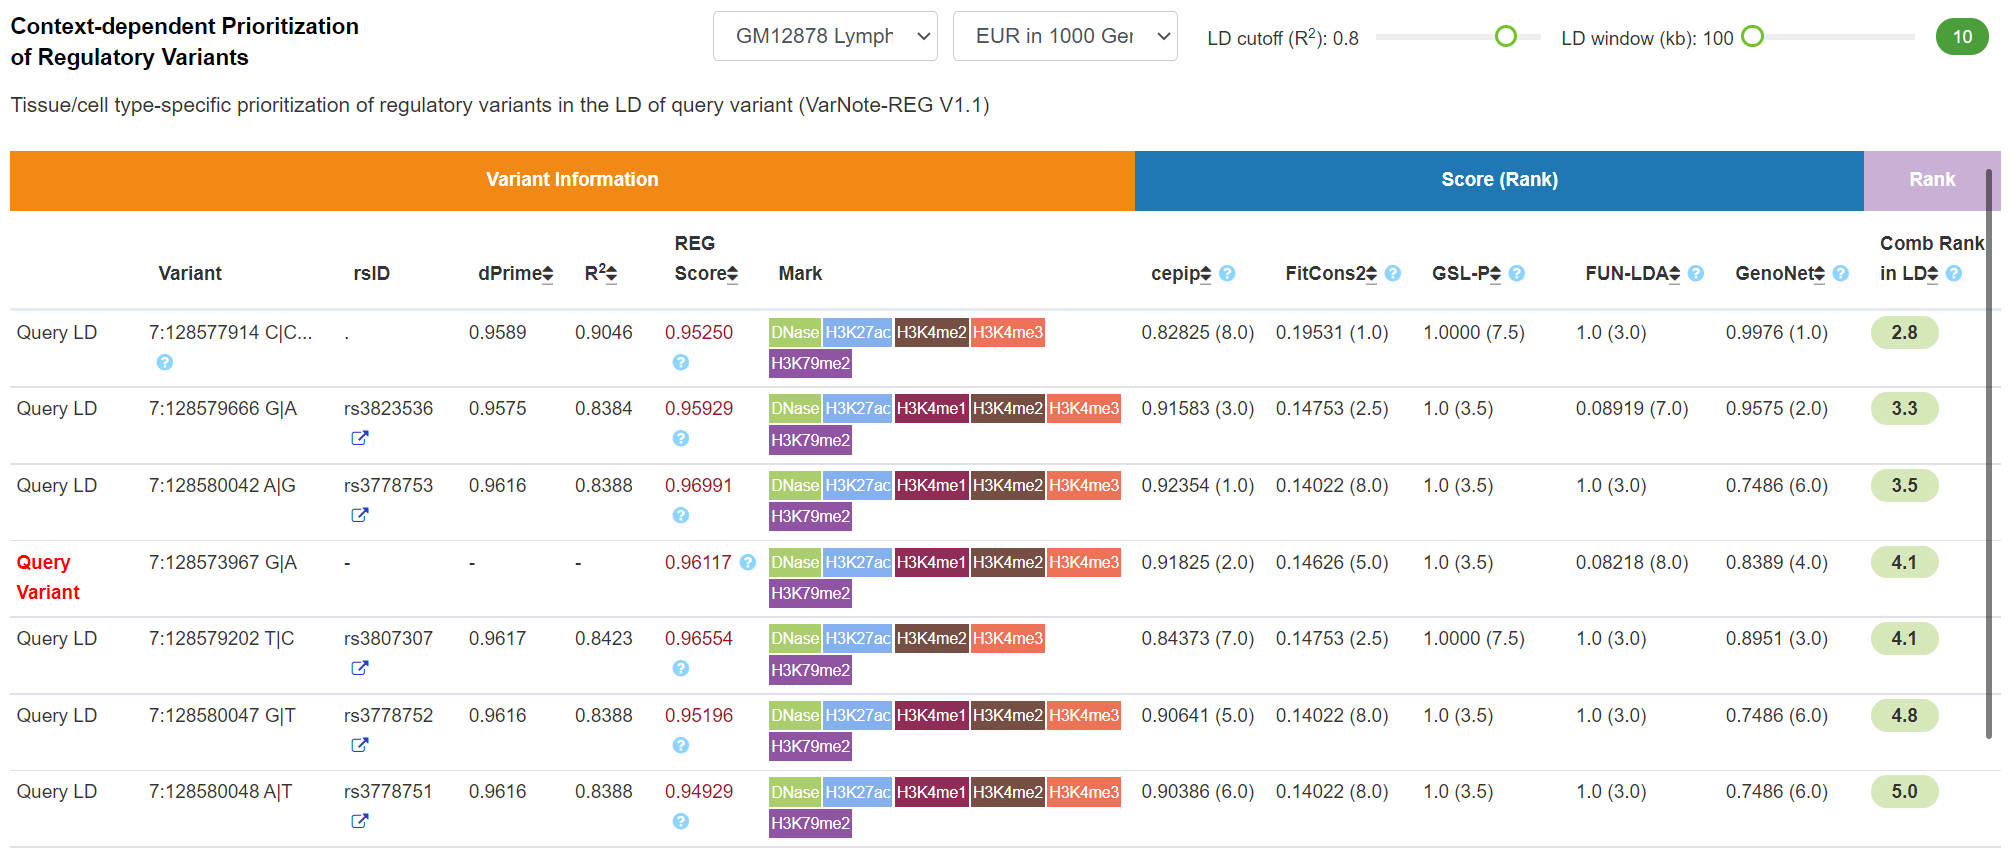
Regulatory Potential - Context-dependent Prioritization of Regulatory Variants
By integrating 127 Roadmap tissue/cell type-specific epigenomic profiles and 5 tissue/cell type-specific prediction tools (including cepip, GenoSkylinePlus, FUN-LDA, FitCons2, GenoNet), VannoPortal can efficiently prioritize causal regulatory variants in the LD of query common variant and provide combined scores. The efficient extraction of LD variants and tissue/cell type-specific information significantly ease the prioritization of context-specific regulatory variants. User can adjust the interested tissue/cell type, population, LD cutoff and window size in this panel. The combine score (smaller one is top ranked) is the rank product of 5 tissue/cell type-specific prediction scores which was described in our previous VarNote paper.
-
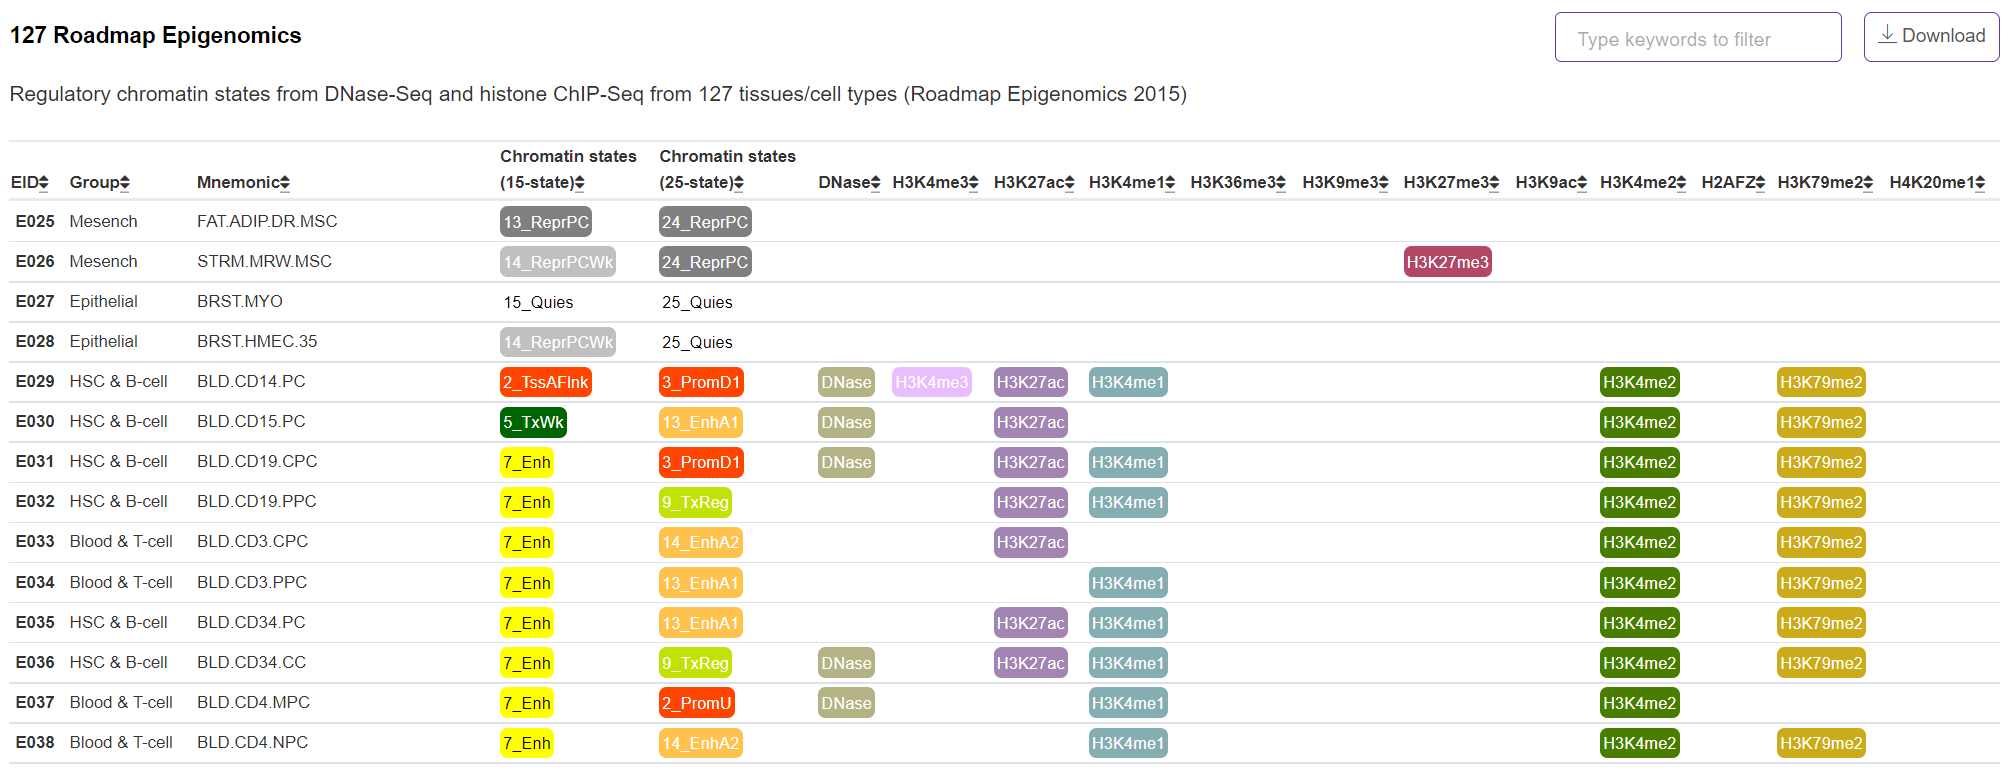
Regulatory Potential - 127 Roadmap Epigenomics
The panel displays the regulatory chromatin states from Roadmap Epigenomics DNase-Seq and histone ChIP-Seq of 127 tissues/cell types profiled by Anshul Kundaje and colleagues in 2015 (https://egg2.wustl.edu/roadmap/web_portal/). The observed (first choice) and imputed narrow peaks were merged and displayed in this panel.
-
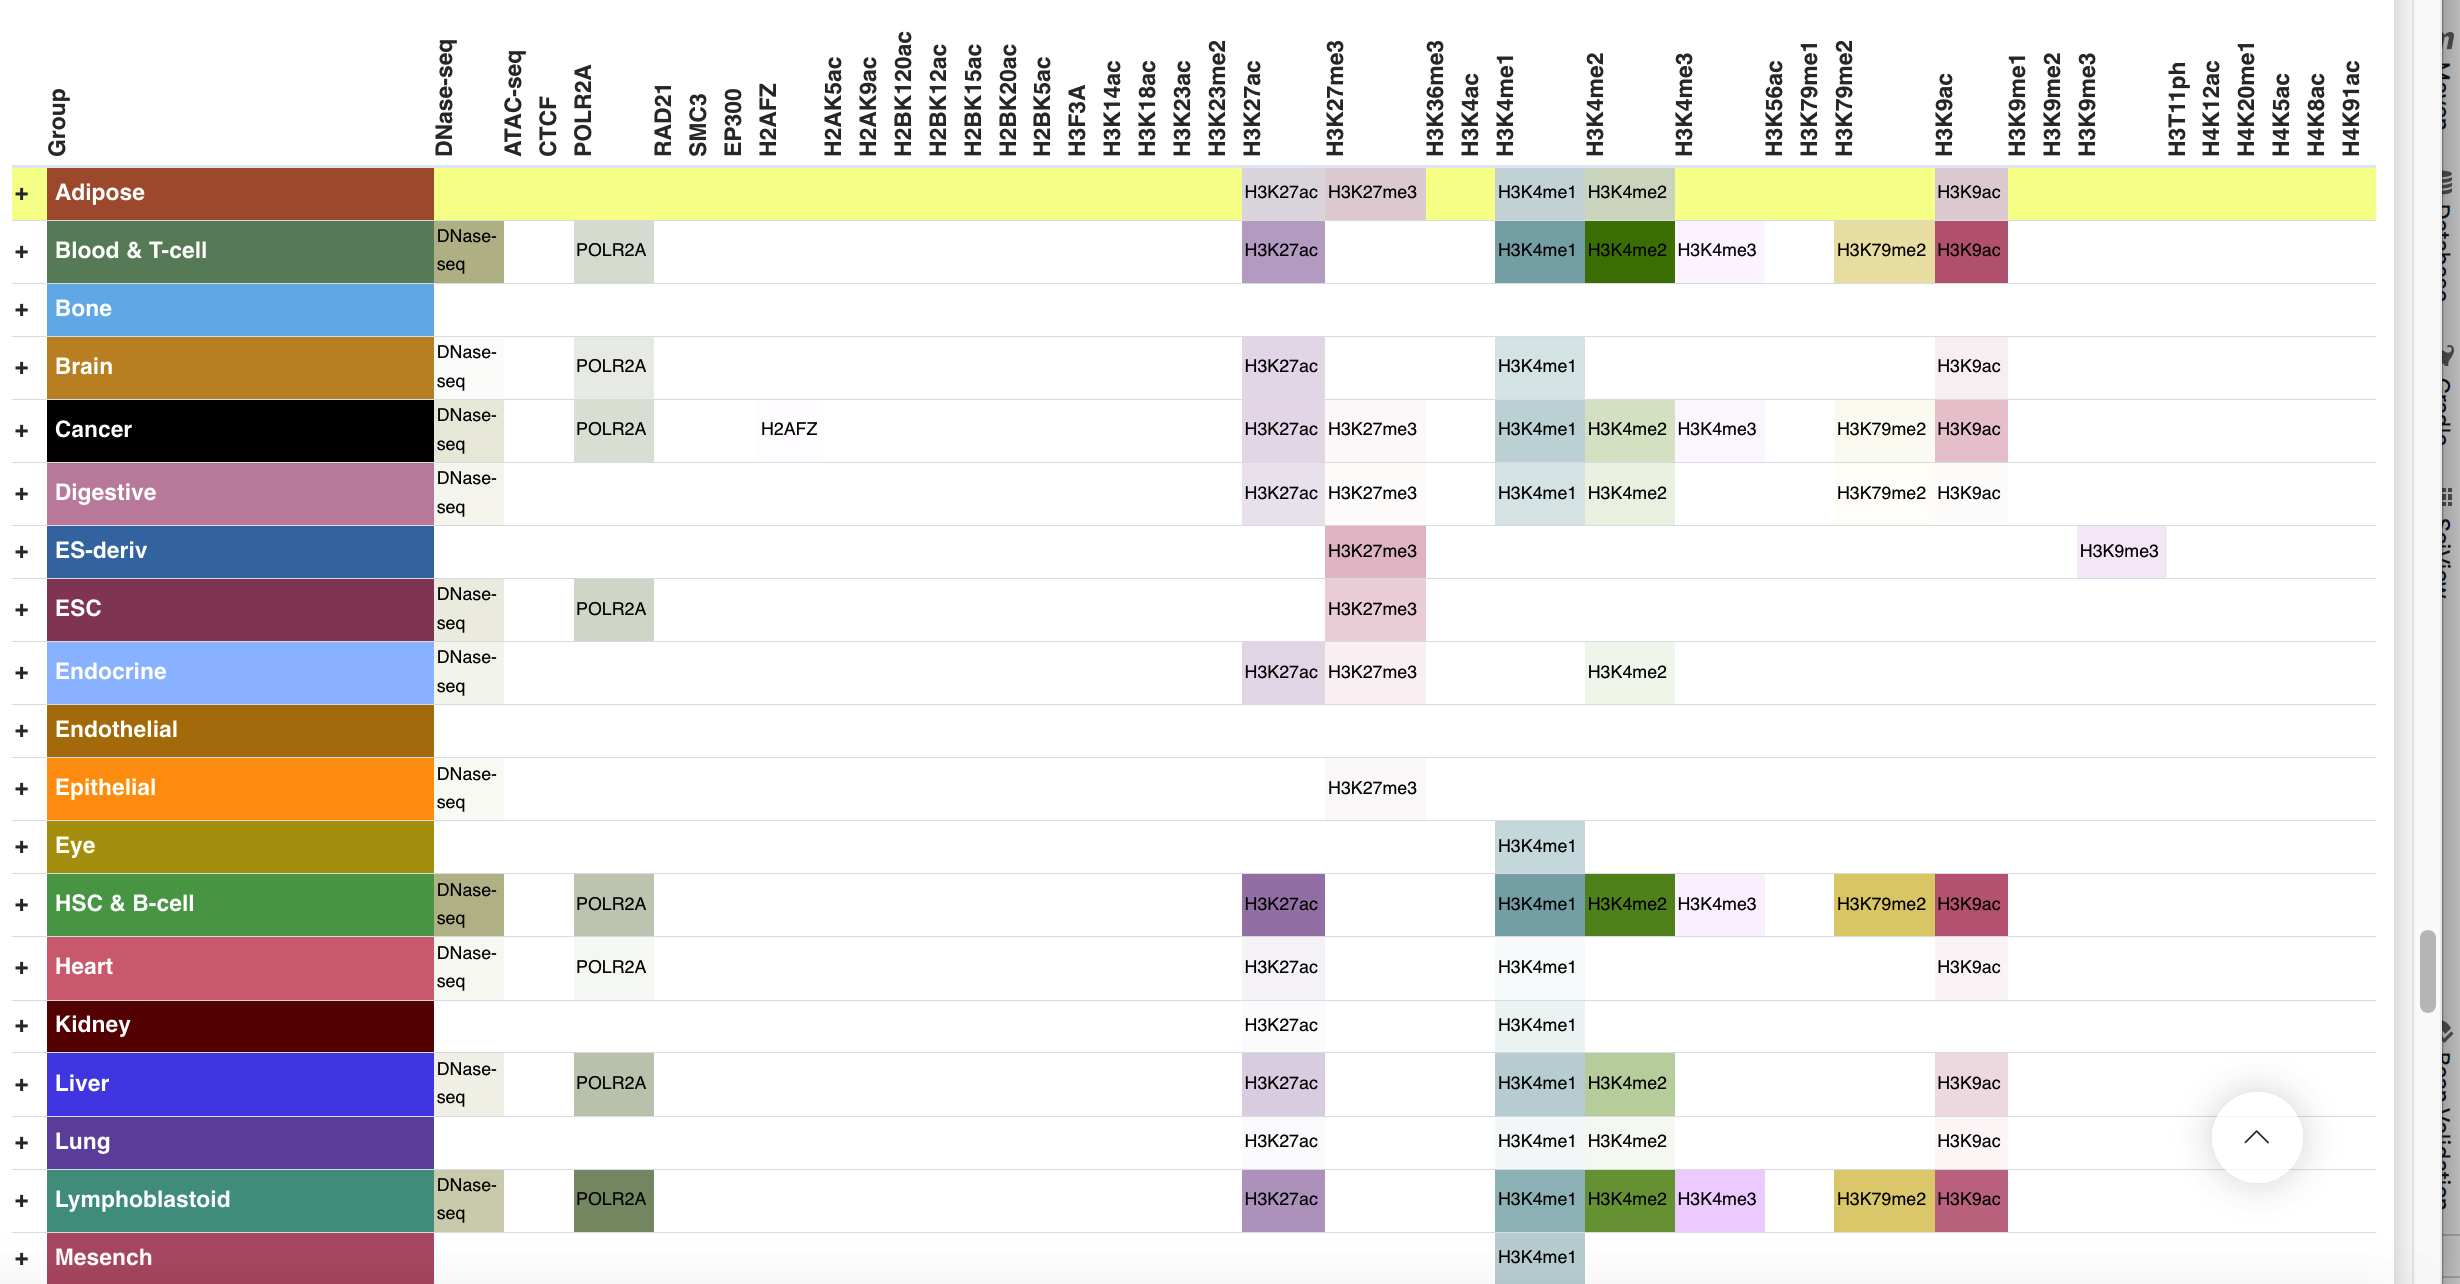
Regulatory Potential - 869 Epimap Epigenomics
The panel displays the regulatory chromatin states from EpiMap DNase-Seq, ATAC-seq, histone ChIP-Seq and selected transcription factor ChIP-seq from 869 biosamples profiled by Carles A. Boix and colleagues in 2021 (http://compbio.mit.edu/epimap/). The observed (first choice) and imputed narrow peaks were called according to Github code of EpiMap project, then were merged and displayed in this panel. The panel consists of two levels of information, including tissue-level signal by summarizing the peaks of each member sample in this tissue, and the sample-level signal by merging the observed and imputed peaks. User can click the interested tissue to inspect sample-level information.
-
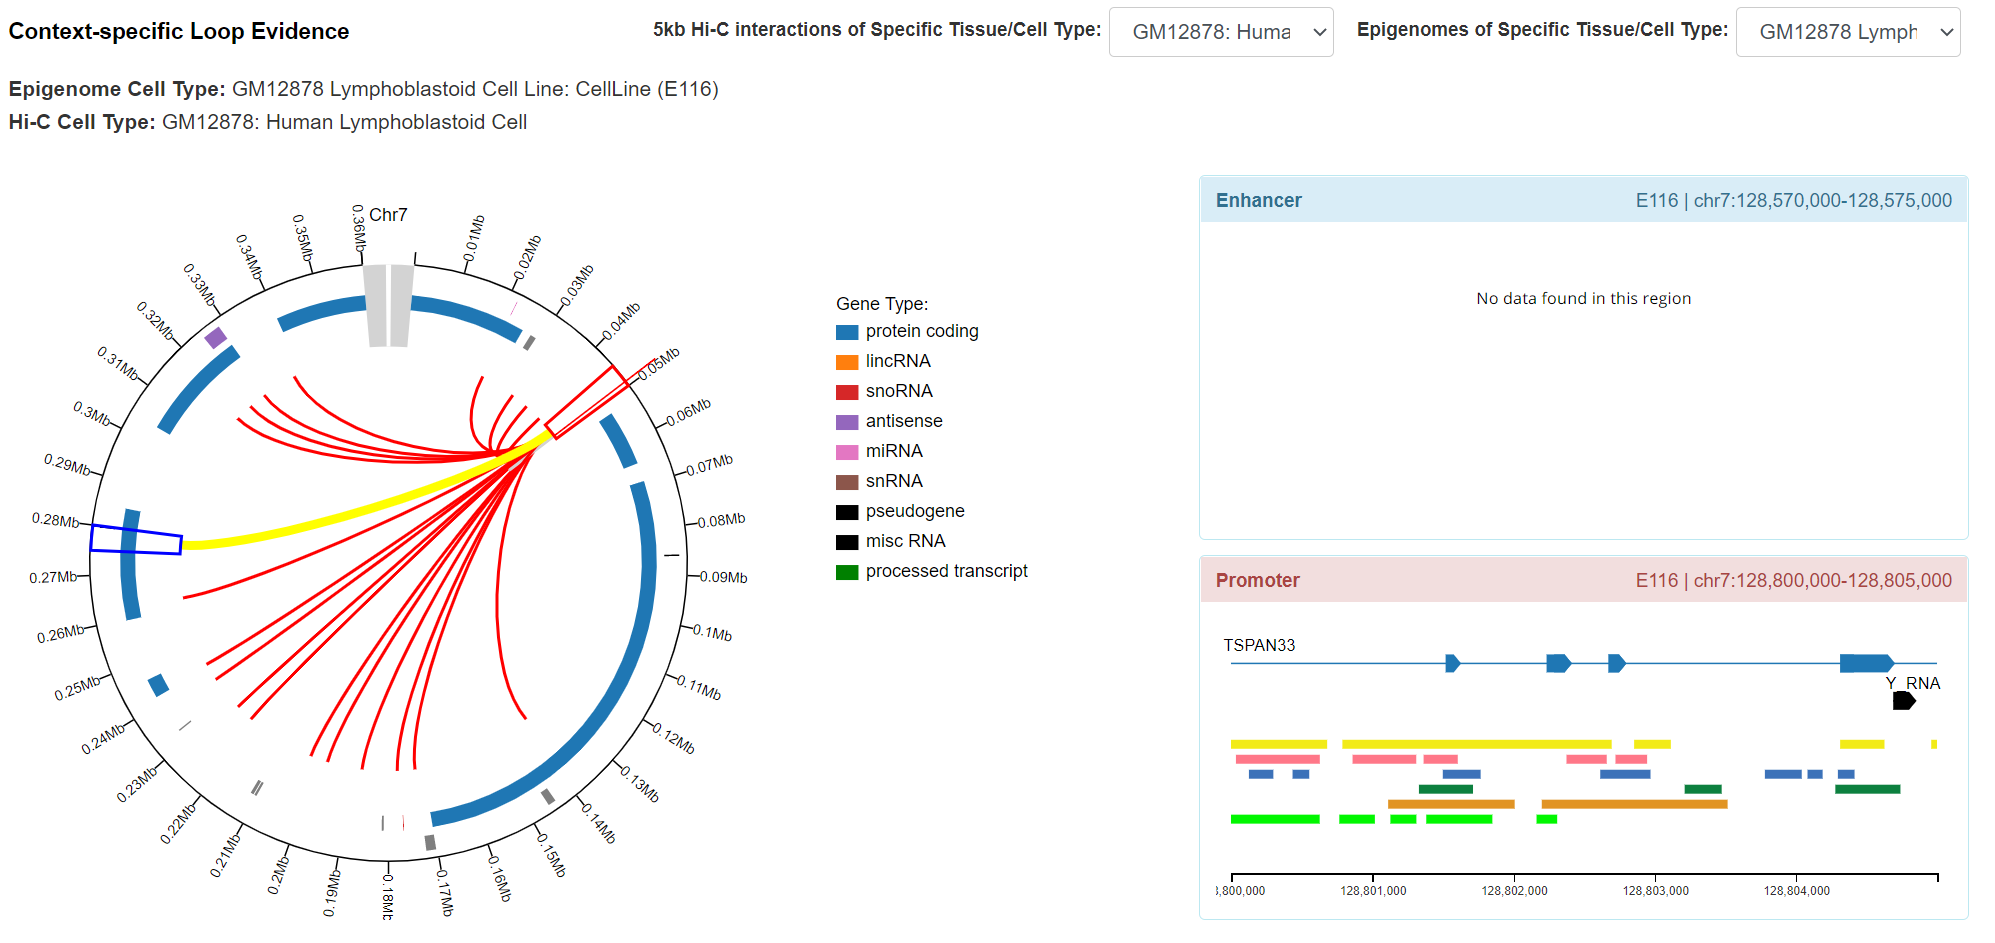
Regulatory Potential - Context-specific Loop Evidence
The panel displays significant Hi-C interactions anchored at variant locus and associated epigenomic signal (from 127 Roadmap Epigenomics) in this locus. Most of the information was derived from our previously uniformly processed 5Kb significant Hi-C interactions using Homer. The genes and 5kb fragments can also be visualized in the plot. By clicking the interaction arc, and it plots the 9 associated chromatin states (map Hi-C tissue/cell type to the most relevant Roadmap epigenome) for variant locus (5kb) and target locus (5kb). The plot was developed by modifying the JS code of Capture HiC Plotter (refer to PMID: 27153610). Also, user can switch the desired Hi-C dataset or tissue/cell type in this panel.
-
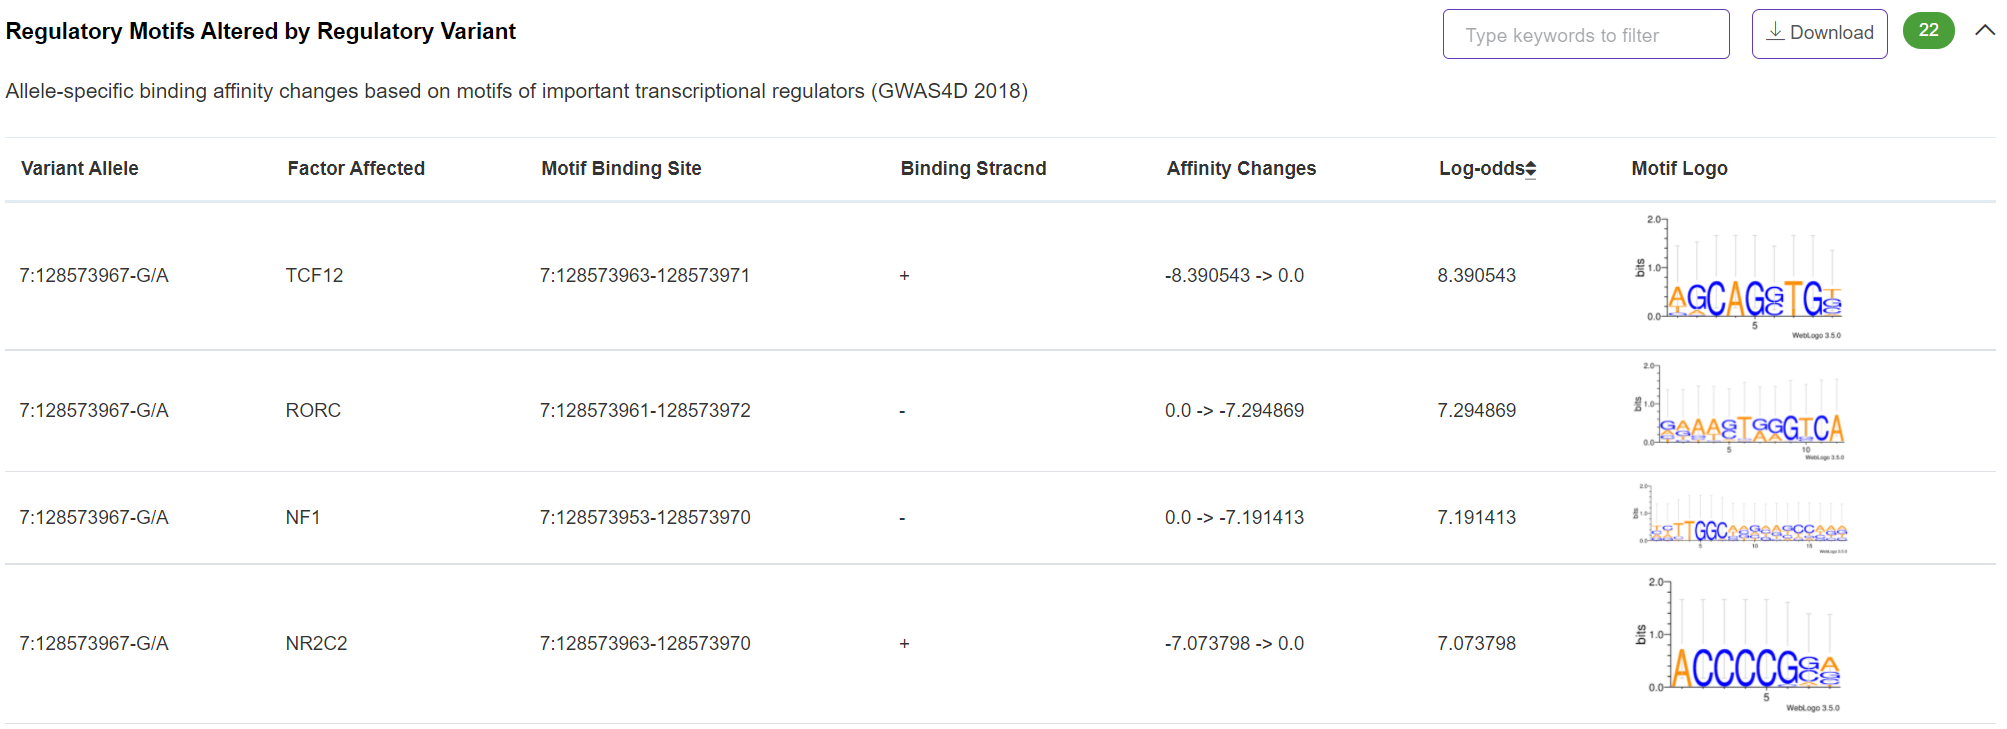
Regulatory Potential - Regulatory Motifs Altered by Regulatory Variant
This important panel shows the real-time calculated binding affinity changes owing to variant allele-specific effect based on motifs of 136 selected transcriptional factors. The motif scanning method and binding affinity change measurement were described in our previous publication (PMID: 23723249).
-
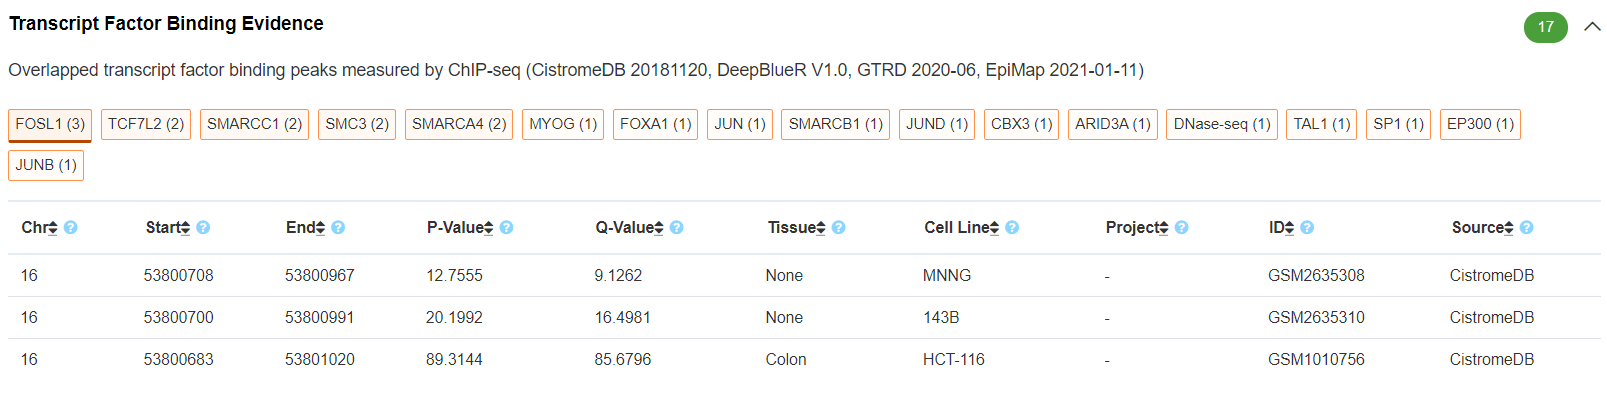
Regulatory Potential - Transcript Factor Binding Evidence
This panel illustrates the variant-overlapped transcript factor binding evidence measured by ChIP-seq. The transcript factor ChIP-seq peaks were integrated from CistromeDB, DeepBlue, GTRD and EpiMap databases. The transcript factors are ordered based on the number of supporting evidence.
-
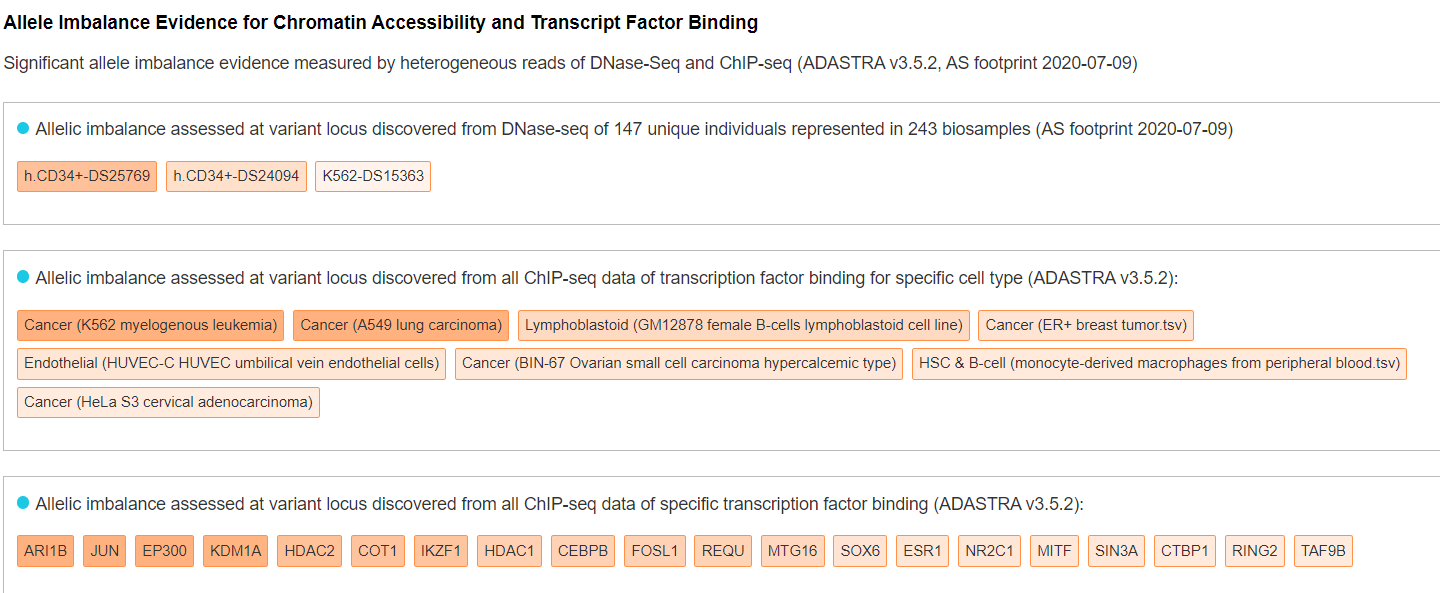
Regulatory Potential - Allele Imbalance Evidence for Chromatin Accessibility and Transcript Factor Binding
This panel displays the allelic imbalance evidence assessed at variant locus discovered from large-scale DNase-seq profiles (PMID: 32728250) and transcription factor ChIP-seq profiles (PMID: 33980847). The related tissues/cell types or transcript factors are ordered based on the significance of allelic imbalance. User can hover each tissue/cell type or transcript factor for detailed information.
-
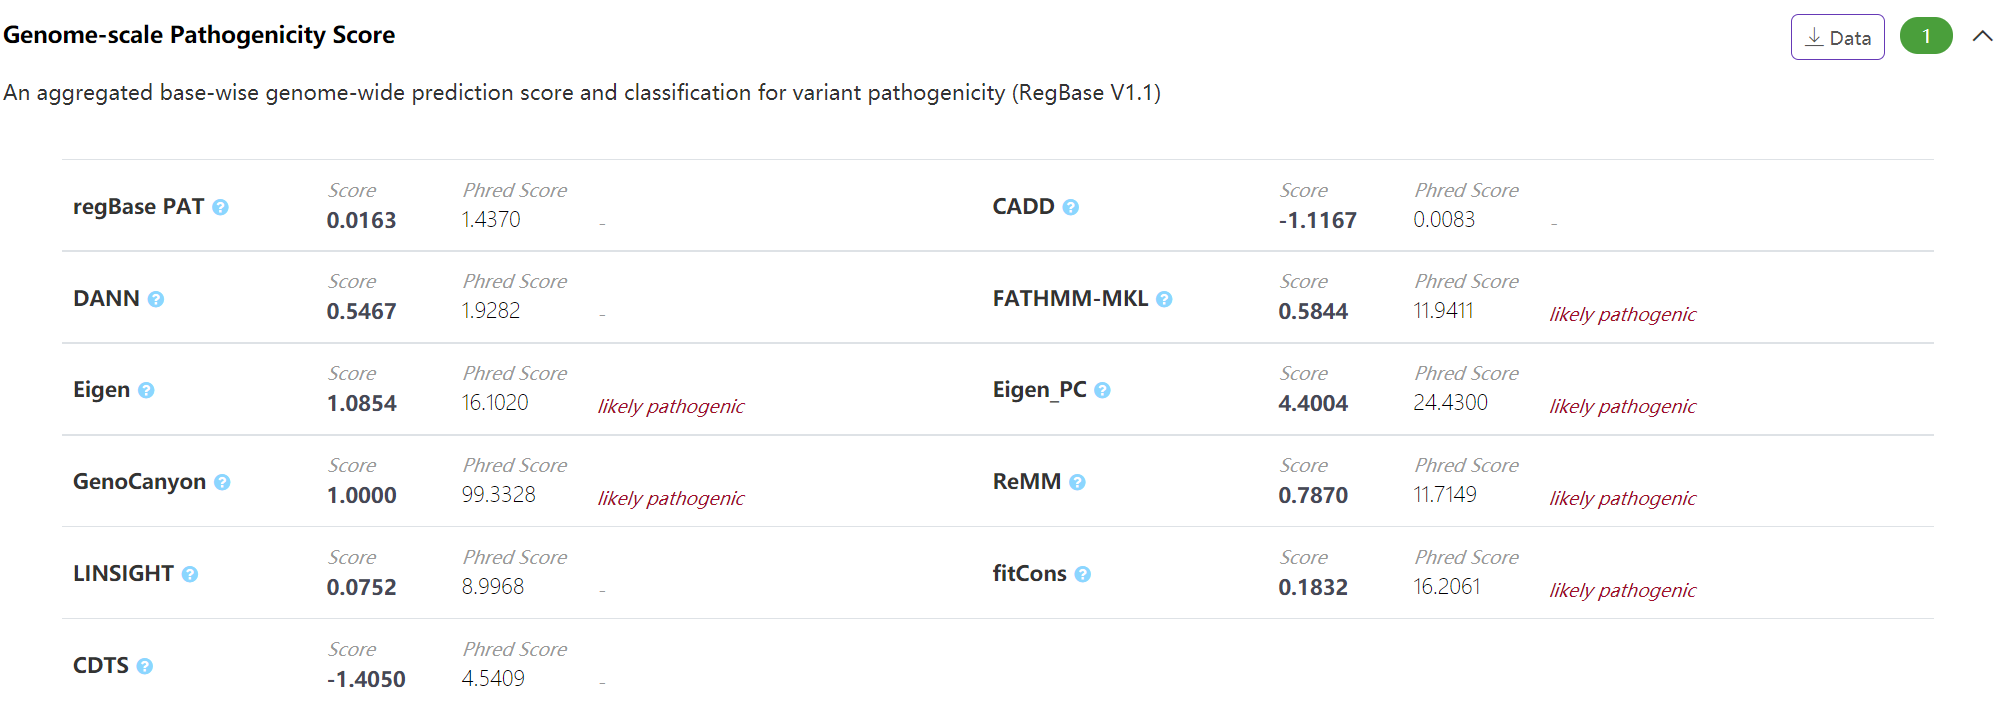
Pathogenicity - Genome-scale Pathogenicity Score
The panel displays genome-scale base-wise pathogenic score integrated form different commonly-used noncoding variant scoring algorithms archived in our regBase (https://github.com/mulinlab/regBase). VannoPortal calculates the "PHRED-scaled" for each of these scores by taking the rank in order of magnitude terms rather than the precise rank itself. In addition, VannoPortal reports the pathogenic classification of certain score based on the Youden's J statistic of each tool reported in regBase.
-
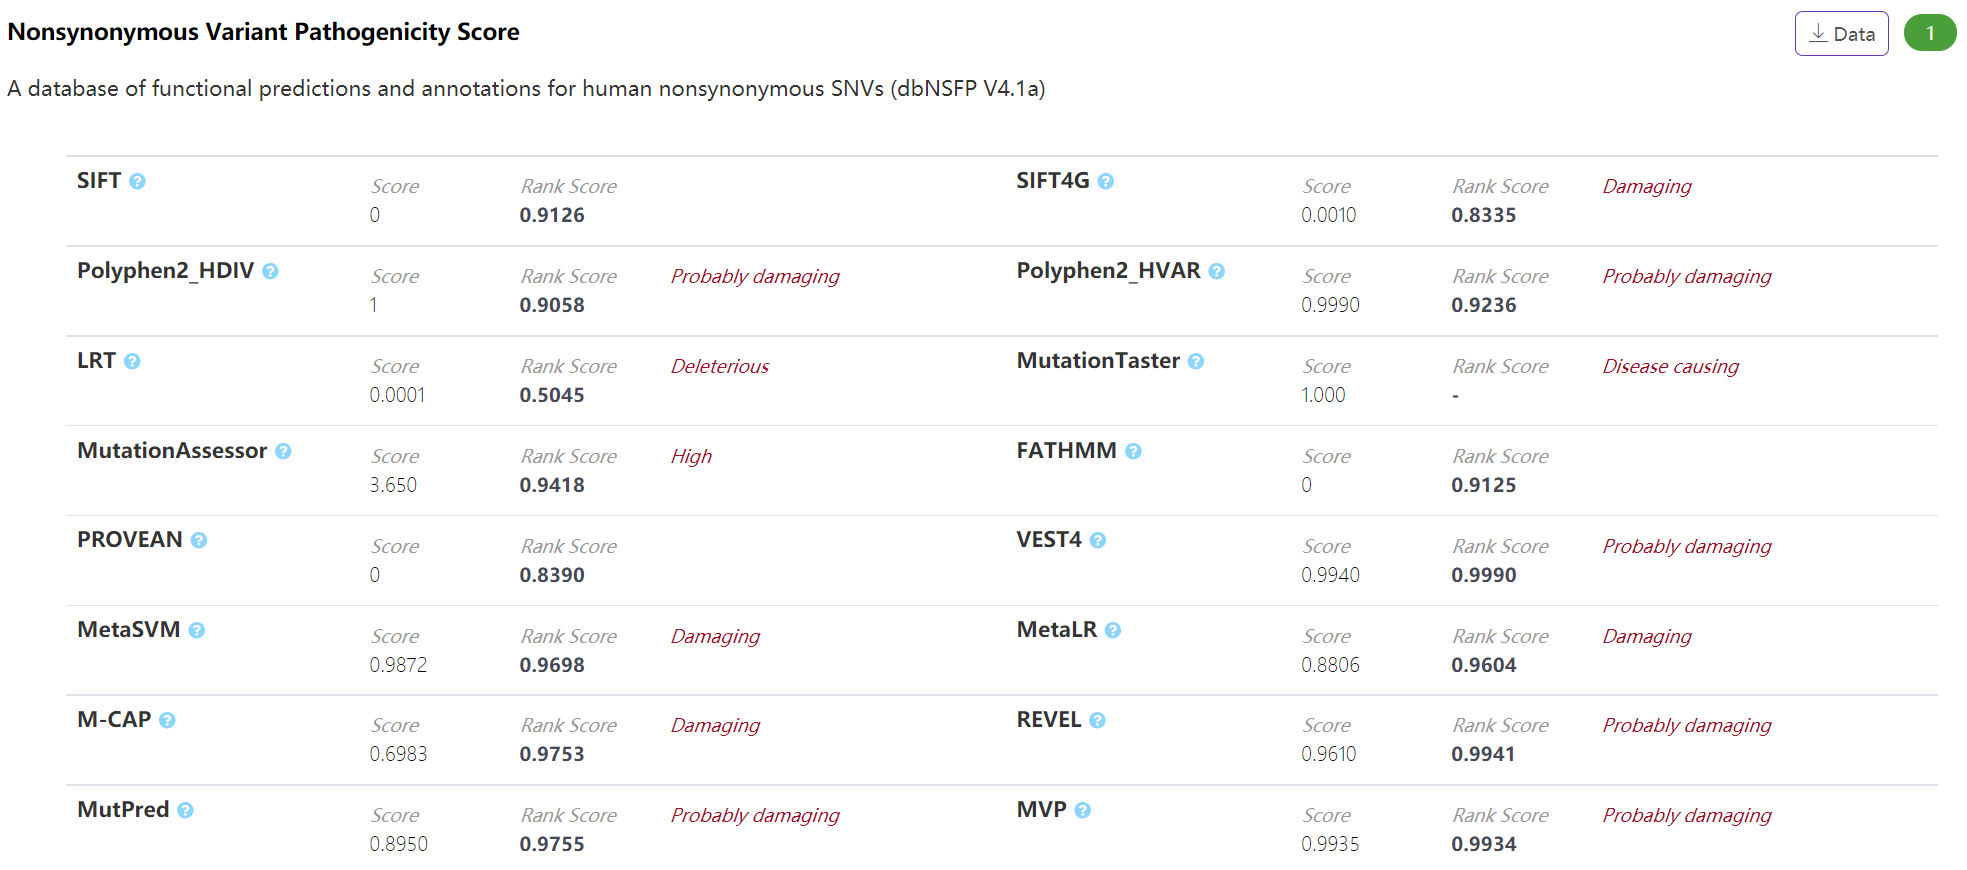
Pathogenicity - Nonsynonymous Variant Pathogenicity Score
The panel displays pathogenic score of nonsynonymous variant integrated from different commonly-used scoring algorithms archived in our dbNSFP (https://sites.google.com/site/jpopgen/dbNSFP). VannoPortal reports the pathogenic classification of certain score based on the recorded “pred” information in dbNSFP.
-
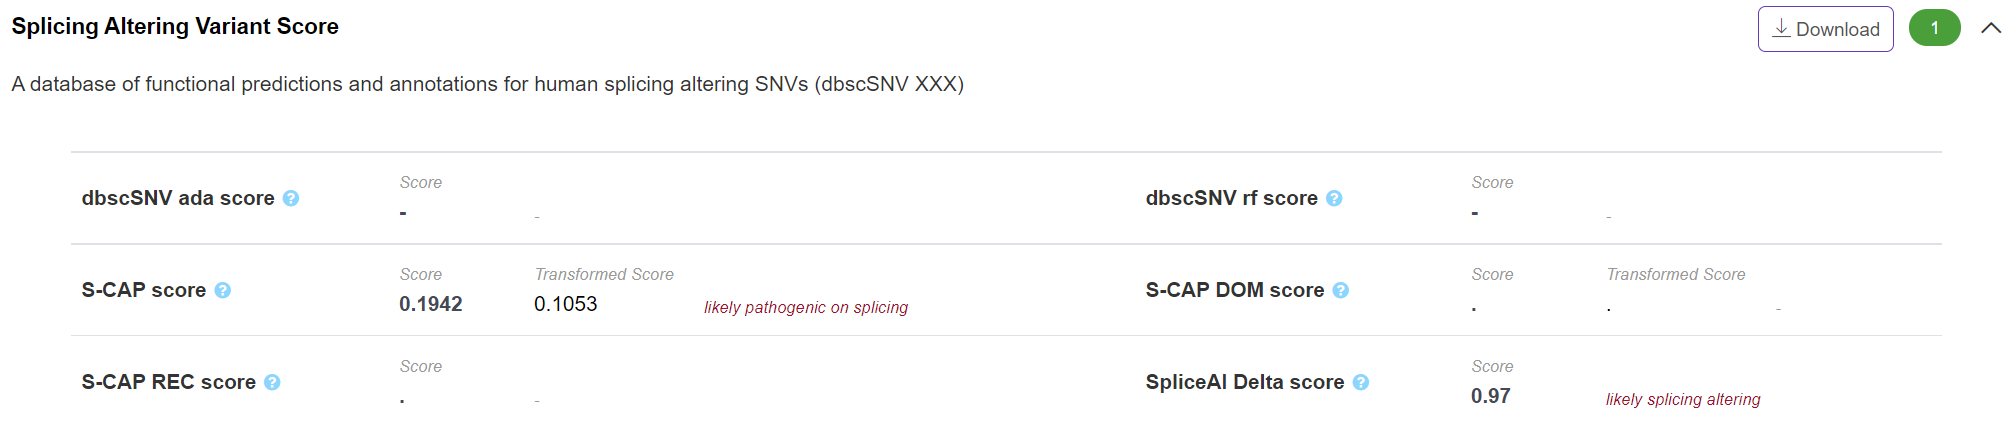
Pathogenicity - Splicing Altering Variant Score
The panel displays splicing-altering scores of exonic/intronic variant around the splicing site which integrated from different scoring algorithms, including dbscSNV, SCAP and SpliceAI. VannoPortal reports the classification of certain score based on the suggested cutoff of corresponding algorithm.
-
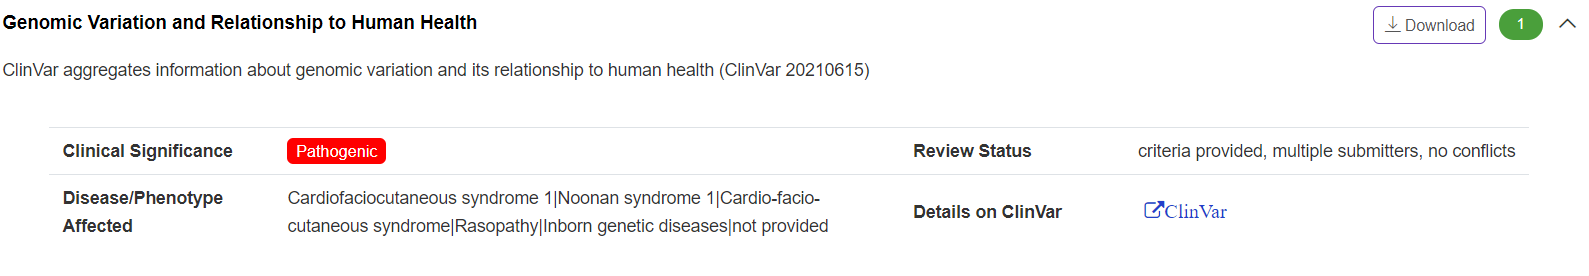
Pathogenicity - Genomic Variation and Relationship to Human Health
The panel summarizes ClinVar (https://www.ncbi.nlm.nih.gov/clinvar/) recorded information about genomic variation and its relationship to human health. The panel summarizes ClinVar (https://www.ncbi.nlm.nih.gov/clinvar/) recorded information about genomic variation and its relationship to human health.
-
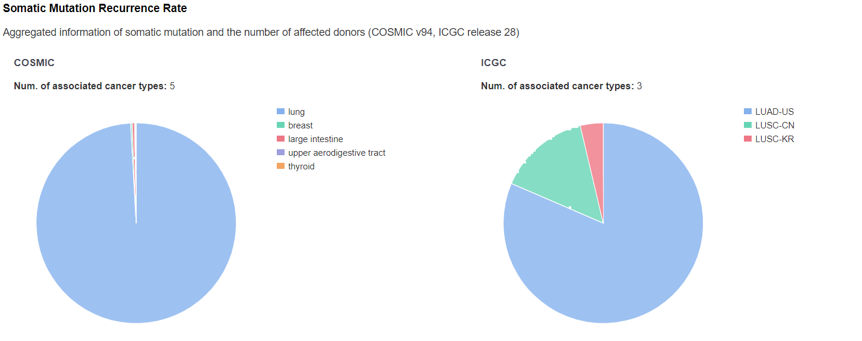
Pathogenicity - Somatic Mutation Recurrence Rate
The panel displays somatic mutation summary information from COSMIC and ICGC. Hovering the pie charts to check more information.
-
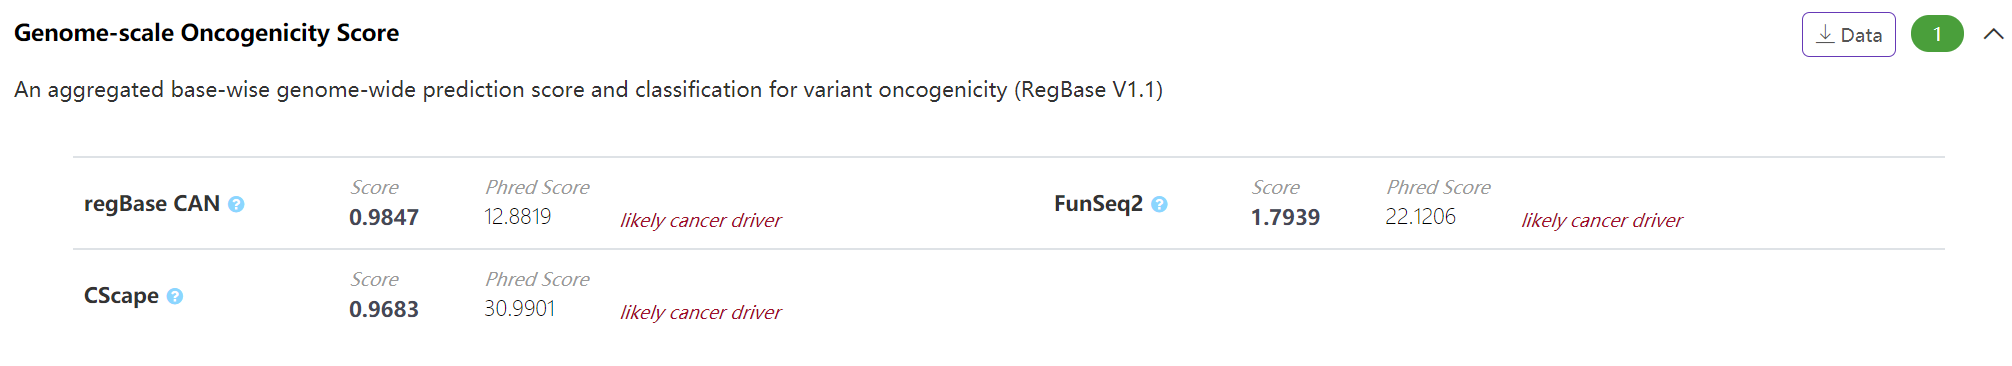
Pathogenicity - Genome-scale Oncogenicity Score
The panel displays genome-scale base-wise pathogenic score integrated from different cancer-driven mutation scoring algorithms archived in our regBase (https://github.com/mulinlab/regBase). VannoPortal calculates the "PHRED-scaled" for each of these scores by taking the rank in order of magnitude terms rather than the precise rank itself. In addition, VannoPortal reports the cancer-driven classification of certain score based on the Youden's J statistic of each tool reported in regBase.
-
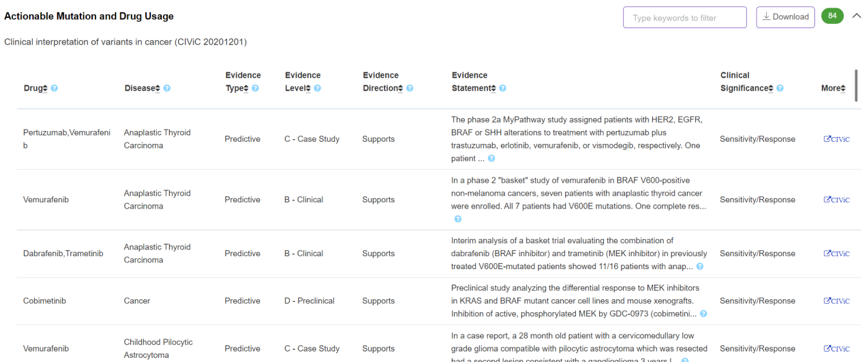
Pathogenicity - Actionable Mutation and Drug Usage
The panel displays clinical interpretation of variants in cancer derived from CIViC (https://civicdb.org/home).
-
Download XLS
VannoPortal allows user to download full annotations of query variant by clicking the “Download XLS” button at the top right of result page. Variant annotations in separate item are also downloadable.
-
Annotation by API
VannoPortal allows user to retrieve annotations (JSON format) through RESTful API:
http://mulinlab.org/vportal/portal/api?q=
[query] &g=[genome] &p=[population] &f=[category] [query] accepts different types of variant format including dbSNP ID, VCF-like, HGVS and genomic coordinates (see query examples);[genome] acceptshg19 andhg38 as input value;[population] acceptseur ,eas ,afr ,amr andsas as input value;[category] acceptsall ,evolution ,phenotype ,regulatory andpathogenicity as input value.
Examples:
http://mulinlab.org/vportal/portal/api?q=rs4728142&g=hg19&p=eur&f=all
http://mulinlab.org/vportal/portal/api?q=rs4728142&g=hg19&p=eur&f=phenotype
http://mulinlab.org/vportal/portal/api?q=rs9812056&g=hg19&p=eur&f=regulatory
http://mulinlab.org/vportal/portal/api?q=chr1:109817590-G-T&g=hg19&p=eur&f=all
http://mulinlab.org/vportal/portal/api?q=1:1186502&g=hg19&p=eur&f=all
http://mulinlab.org/vportal/portal/api?q=chr7:g.140453136A>T&g=hg19&p=eur&f=pathogenicity
Some notes for interpreting JSON result:
regulatory-epiMap : please click link https://personal.broadinstitute.org/cboix/epimap/metadata/Short_Metadata.html to get information of biosample ID.
Data used in VannoPortal
| Category | Annotation Item | Data Source | Version | URL | PMID |
|---|---|---|---|---|---|
| Basic Information | Variant Summary | dbSNP | b151 | https://ftp.ncbi.nih.gov/snp/ | 11125122 |
| Basic Information | Variant Summary | 1000 Genomes project | phase3 | https://www.internationalgenome.org/category/phase-3/ | 26432245 |
| Basic Information | Variant Summary | gnomAD | r2.0.2 | https://gnomad.broadinstitute.org/ | 32461654 |
| Basic Information | Variant Summary | Jannovar | v0.30 | https://github.com/charite/jannovar | 24677618 |
| Basic Information | Variant Summary | ABraOM | 2017/3/23 | http://abraom.ib.usp.br/ | 28332257 |
| Basic Information | Variant Summary | GAsP | 2019/12/1 | https://genomeasia100k.org/ | 31802016 |
| Basic Information | Variant Summary | jMorp | 8.3KJPN | https://jmorp.megabank.tohoku.ac.jp | 33179747 |
| Basic Information | Variant Summary | UKBB NealeLab | 2017/9/20 | http://www.nealelab.is/uk-biobank/ | 30305743 |
| Basic Information | Variant Summary | UK10K COHORT | 2016/2/15 | https://www.uk10k.org/ | 26367797 |
| Basic Information | Variant Summary | Intervar | 2018/1/18 | https://annovar.openbioinformatics.org/ | 28132688 |
| Evolution | Conservation | dbCons | V 1.0 | Internal | NA |
| Evolution | Positive Selection | dbPSHP | V 1.2 | Internal | 24194603 |
| Phenotype | LD Information | 1000 Genomes project | phase3 | https://www.internationalgenome.org/category/phase-3/ | 26432245 |
| Phenotype | Trait Association | GWAS Catalog | V1.0.2 | https://www.ebi.ac.uk/gwas/ | 27899670 |
| Phenotype | Causal Variant | CAUSALdb | V1.1 | http://mulinlab.org/causaldb | 31691819 |
| Phenotype | eQTL | GTEx | V8 | https://www.gtexportal.org/ | 23715323 |
| Phenotype | sQTL | GTEx | V8 | https://www.gtexportal.org/ | 23715323 |
| Regulatory Potential | LD Prioritiaztion | VarNote-REG | V 1.1 | http://mulinlab.org/varnote | 33060171 |
| Regulatory Potential | Roadmap Epigenomics | Roadmap Epigenomics 2015 | 2016/3/5 | https://egg2.wustl.edu/roadmap/web_portal/ | 20944595 |
| Regulatory Potential | Epimap Epigenomics | Epimap Epigenomics 2021 | 2021/1/11 | http://compbio.mit.edu/epimap | 33536621 |
| Regulatory Potential | 3D Genomes | GWAS4D | V 1.0 | http://mulinlab.org/gwas4d/ | 29771388 |
| Regulatory Potential | Motif Altered | Intergrated Motifs | V 1.0 | internal | NA |
| Regulatory Potential | TF Binding | Epimap Epigenomics 2021 | 2021/1/11 | http://compbio.mit.edu/epimap | 33536621 |
| Regulatory Potential | TF Binding | CistromeDB | 2018/11/20 | http://cistrome.org/db/ | 27789702 |
| Regulatory Potential | TF Binding | DeepBlueR | V 1.0 | http://deepblue.mpi-inf.mpg.de | 28334349 |
| Regulatory Potential | TF Binding | GTRD | Jun-20 | http://gtrd.biouml.org | 33231677 |
| Regulatory Potential | Allele Imbalance | ADASTRA | v3.5.2 | https://adastra.autosome.ru | 33980847 |
| Regulatory Potential | Allele Imbalance | AS footprint | 2020/7/9 | https://resources.altius.org/~jvierstra/projects/footprinting.2020/allelic_imbalance/ | 32728250 |
| Pathogenicity | Pathogenicity Score | regBase | V 1.1 | https://github.com/mulinlab/regBase | 31511901 |
| Pathogenicity | Missense Pathogenicity | dbNSFP | V4.1a | https://sites.google.com/site/jpopgen/dbNSFP | 33261662 |
| Pathogenicity | Splicing Alteration | dbscSNV | V 1.1 | https://sites.google.com/site/jpopgen/dbNSFP | 25416802 |
| Pathogenicity | Splicing Alteration | SCAP | V 1.0 | http://bejerano.stanford.edu/scap/ | 30804562 |
| Pathogenicity | Splicing Alteration | SpliceAI | 2019/1/17 | https://github.com/Illumina/SpliceAI | 30661751 |
| Pathogenicity | ClinVar | ClinVar | 2021/6/15 | https://www.ncbi.nlm.nih.gov/clinvar/ | 26582918 |
| Pathogenicity | Somatic Recurrence | COSMIC | v94 | http://cancer.sanger.ac.uk/cosmic | 27899578 |
| Pathogenicity | Somatic Recurrence | ICGC | release 28 | https://dcc.icgc.org/ | 20393554 |
| Pathogenicity | Oncogenicity Score | regBase | V 1.1 | https://github.com/mulinlab/regBase | 31511901 |
| Pathogenicity | Mutation Actionability | CIViC | 2020/12/1 | https://civicdb.org/home | 2813815 |
Contact
We welcome any discussion, suggestion and potential contribution of new functional annotations as well as prediction scores through contact Dr. Mulin Jun Li (mulinli{at}connect.hku.hk).